Strong hands or weak hands
“Nowadays people know the price of everything and the value of nothing.”
~ Oscar Wilde
Strong hands are long-term investors, including most institutional investors, who focus on intrinsic value and are insensitive to price.
Weak hands and leveraged investors are highly sensitive to price. They follow the news cycle in an often unsuccessful attempt to to time purchases and sales according to short-term, often random, fluctuations in price.
Weak hands respond emotionally to price movements -- making it difficult to be objective in their decisions to buy or sell -- while strong hands focus on dividends and other measures of long-term value.
Strong hands recognize that the biggest obstacle to sound investing is their own emotional response to rising or falling prices. Weak hands submit to the psychological pressure, make frequent buy and sell decisions, and find it difficult to be objective. Strong hands detach themselves as far as possible from the price cycle and the emotional pressures that accompany it.
At the peak of the investment cycle, weak hands pay way above fair value for stocks, while strong hands resist the urge to buy when price exceeds their own objective view of long-term fair value.
As confidence decays and prices fall, weak hands are shaken out of their positions. Margin calls force some to liquidate while others sell through through fear -- failing to recognize that anxiety is the primary cause of falling prices. Some try to hold on to their positions but eventually succumb to the pressure. The mental anguish of watching their stocks fall often drives them to sell at way below fair value -- just to end the pain.
Strong hands are patient, independent of the herd, and unmoved by the wild emotional swings of bull and bear markets. They wait for stock prices to fall to below fair value, when opportunity is at its maximum. Stocks that are gradually recovering from a steep sell-off and scarce retail buyers are signs that a bottom has been reached.
Recency bias
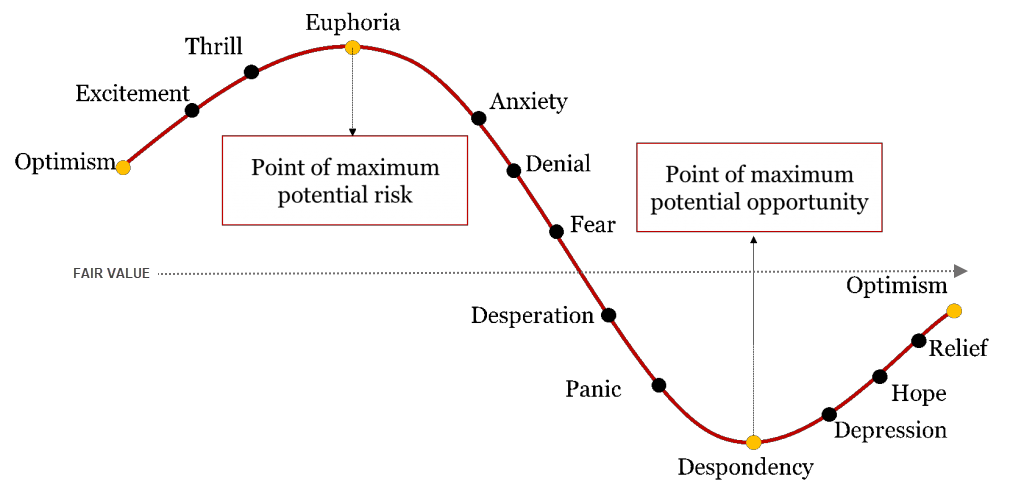
One of the key benefits of years of investing, through several stock market cycles, is the ability to recognize the familiar signs of euphoria in a bull market and despondency in a bear market. When it seems that the bull market will never end, that is normally a sign that risk is elevated. Conversely, opportunity is at its maximum when an air of despair and despondency descends on the investing public.
Don't confuse price with value
Price seldom equates to value.
Short-term investors confuse price with value, making them vulnerable to wild price swings which can weaken the resolve of even the most hardened investors.
Long-term investors hold the majority of their investments through several investment cycles, pruning only those stocks where long-term revenue growth or profit margins have been permanently affected and are unlikely to recover.
Supply and demand
Many readers are familiar with supply and demand curves from basic economics. For those who are not, here's a quick refresher:
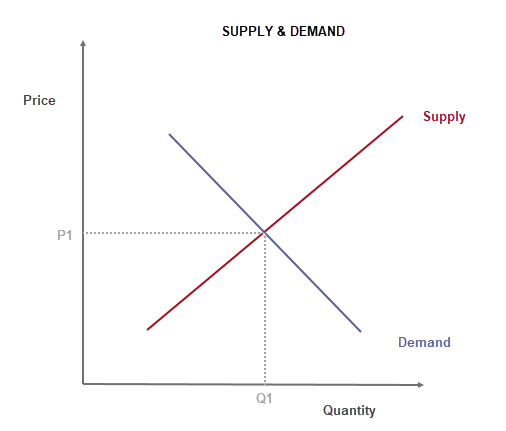
- The supply curve, represented by the red line on the chart below, represents the quantity available for sale (bottom axis) at any given price (left axis). The higher the price, the greater the supply.
- The demand curve, represented by the blue line on the chart below, represents the quantity that buyers are willing to purchase (bottom axis) at any given price (left axis). The lower the price, the greater the demand1.
- Price is determined by the intersection of the two curves, maximizing the value achieved -- at quantity sold (Q1) and price (P1) -- giving value of Q1*P1.
Bear markets
In a bear market, the supply curve moves to the right as weak hands are influenced by falling prices and a negative media cycle. Note that the bottom end of the curve shifts a lot more than the top -- strong hands are relatively unmoved by market sentiment.
Price falls steeply, from P1 to P2, as weak hands increase the quantity available for sale. Volume sold increases from Q1 to Q2.
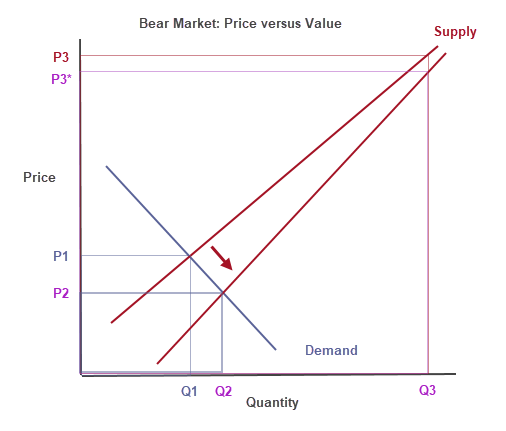
We need to be careful not to equate the price at P1 or P2 with value. They may reflect the marginal price at which you can acquire new stock (or sell existing holdings) but they do not reflect the price at which strong hands are prepared to sell. That is why takeover offers are normally priced at a substantial premium to the current traded stock price. If you had to increase the quantity that you want to purchase to Q3, you would have to move up the supply curve, to the right, and price increases to P3 in order to attract more sellers2.
Market capitalization, likewise, is simply the number of shares in issue multiplied by the current traded stock price and is not a reflection of the intrinsic value of a company.
Conclusion
Investors need to have a clear idea of their investment time frame and adjust their approach accordingly.
One of the worst possible mistakes is indecision. If undecided, you are likely to be caught between two stools, buying late in an up-trend and selling late in a down-trend.
If you are a weak hand, it is far better to recognize that. Resist buying near the top of the cycle; apply sound money management -- position-sizing is vital if you are focused on price; sell early, at the first signs of a bear market; and never, ever trade against the trend.
If you are a strong hand, never confuse price with value. Focus on dividends and other long-term measures of value; stay detached from the herd; and have the patience to wait for opportunity -- when prices are trading at way below fair value.
Notes
- Discussion of inelastic supply curves and negative-sloping demand curves is beyond the scope of this article.
- P3 will shift to P3* in a bear market.
Acknowledgements
Hat tip to RBC Wealth Management for the investment cycle chart to which we added fair value.
The original article was published for Patient Investor subscribers on June 26, 2022.
Quote for the Week
“The stock market remains an exceptionally efficient mechanism for the transfer of wealth from the impatient to the patient.”
~ Warren Buffett
Recent updates for Market Analysis Subscribers
Take advantage of our $1 special. New subscribers only.
Colin Twiggs is director of The Patient Investor Pty Ltd, an Authorised Representative (no. 1256439) of MoneySherpa Pty Limited which holds Australian Financial Services Licence No. 451289.
Everything contained in this web site, related newsletters, training videos and training courses (collectively referred to as the "Material") has been written for the purpose of teaching analysis, trading and investment techniques. The Material neither purports to be, nor is it intended to be, advice to trade or to invest in any financial instrument, or class of financial instruments, or to use any particular methods of trading or investing.
Advice in the Material is provided for the general information of readers and viewers (collectively referred to as "Readers") and does not have regard to any particular person's investment objectives, financial situation or needs. Accordingly, no Reader should act on the basis of any information in the Material without properly considering its applicability to their financial circumstances. If not properly qualified to do this for themselves, Readers should seek professional advice.
Investing and trading involves risk of loss. Past results are not necessarily indicative of future results.
You, the Reader, need to conduct your own research and decide whether to invest or trade. The decision is yours alone. We expressly disavow all and any liability to any person, with respect of anything, and of the consequences of anything, done or omitted to be done by any such person in reliance upon the whole or any part of the Material.
Read the Financial Services Guide.

Author: Colin Twiggs is a former investment banker with almost 40 years of experience in financial markets. He co-founded Incredible Charts and writes the popular Trading Diary and Patient Investor newsletters.
Using a top-down approach, Colin identifies key macro trends in the global economy before evaluating selected opportunities using a combination of fundamental and technical analysis.
Focusing on interest rates and financial market liquidity as primary drivers of the economic cycle, he warned of the 2008/2009 and 2020 bear markets well ahead of actual events.
He founded PVT Capital (AFSL No. 546090) in May 2023, which offers investment strategy and advice to wholesale clients.