Seasons Greetings/What is causing the current S&P 500 rise and how is it likely to end?
By Colin Twiggs
December 22, 2019 8:30 p.m. EDT (12:30 p.m. AEDT)
First, please read the Disclaimer.
Seasons Greetings

Dear Friends,
This is our last weekly market update for the year. I will be taking a break over Christmas and the New Year and will return early January. I will drop you a note if I see anything interesting before then.
We wish you peace and goodwill over the Christmas season and prosperity in the year ahead.
New format
Most of you are aware that changes in the advertising market have forced us to change our format to a subscription newsletter under The Patient Investor. The example below is our most recent newsletter.
Please take advantage of the $1 subscription for the first month.
What is causing the current S&P 500 rise and how is it likely to end?
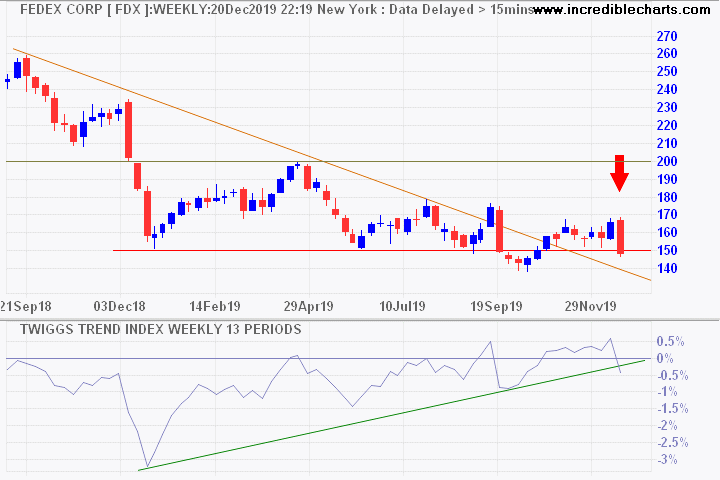
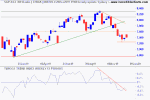
In November 2007, six months after the inverted yield curve (3M-10Y) recovered to a positive slope, bellwether transport stock Fedex broke primary support at 100 to warn of an economic slow-down.
Today, two months after rate cuts restored an inverted yield curve to positive, Fedex again broke primary support, this time at 150. Their CEO Fred Smith observed that the stock market may be booming but the "industrial economy does not reflect any growth at all."
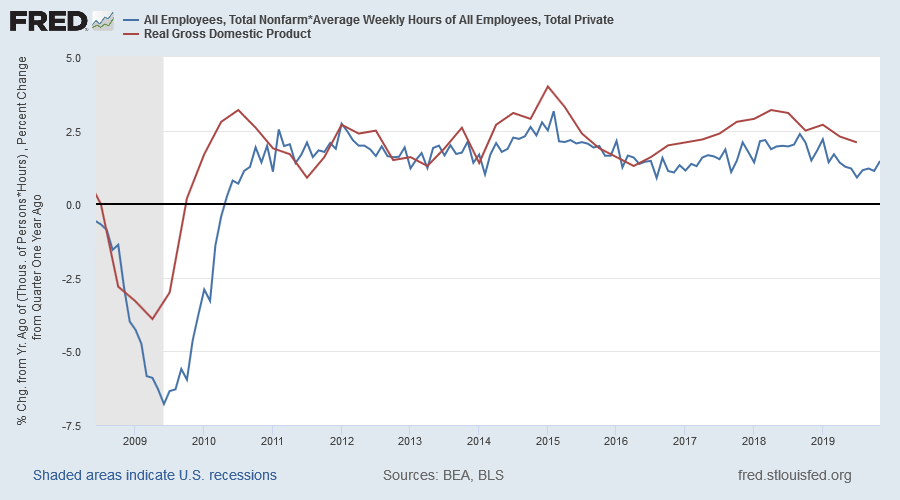
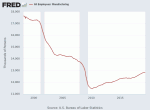
Real GDP growth is slowing, with our latest estimate, based on weekly hours worked, projecting GDP growth of 1.5% for the calendar year.
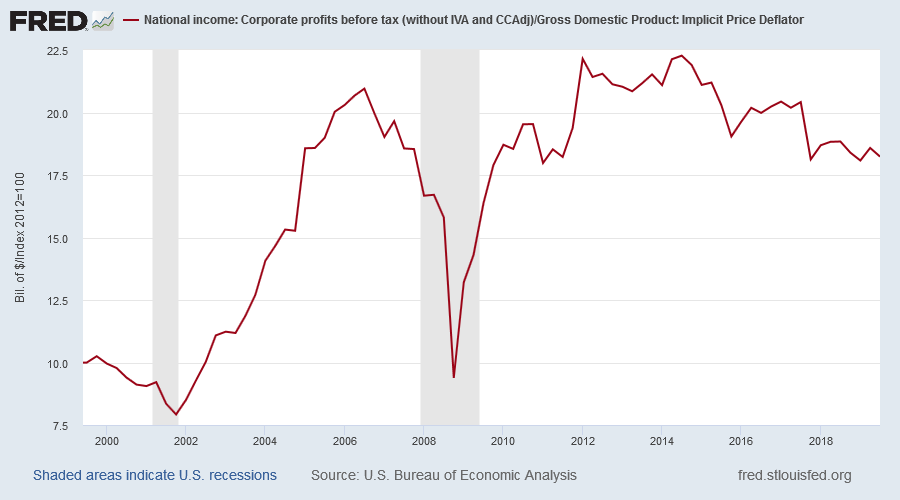
While real corporate profits are declining.
What is keeping stocks afloat?
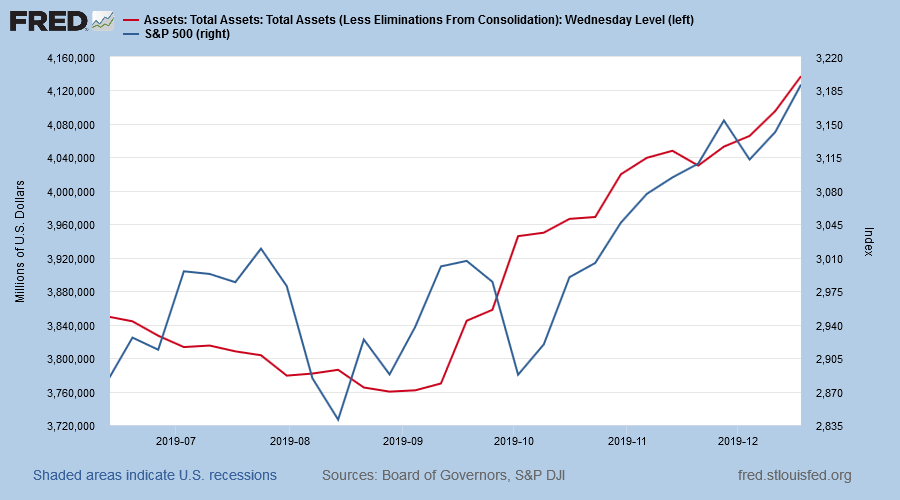
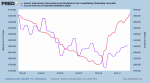
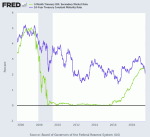
First, a flood of new money from the Fed. They expanded their balance sheet by $375 billion since September 2019 and are expected to double that to $750 billion — bringing total Fed holdings to $4.5 trillion by mid-January — to head off an expected liquidity crisis in repo and FX swap markets. The red line below shows expansion of the Fed's balance sheet, while the blue shows how the S&P 500 index responded.
Second, ultra-low bond yields have starved investment markets of yield, boosting earnings multiples. P/E of historic earnings rose to 22.01 at the end of the September quarter and is projected to reach 22.82 in the December quarter (based on current S&P earnings estimates).
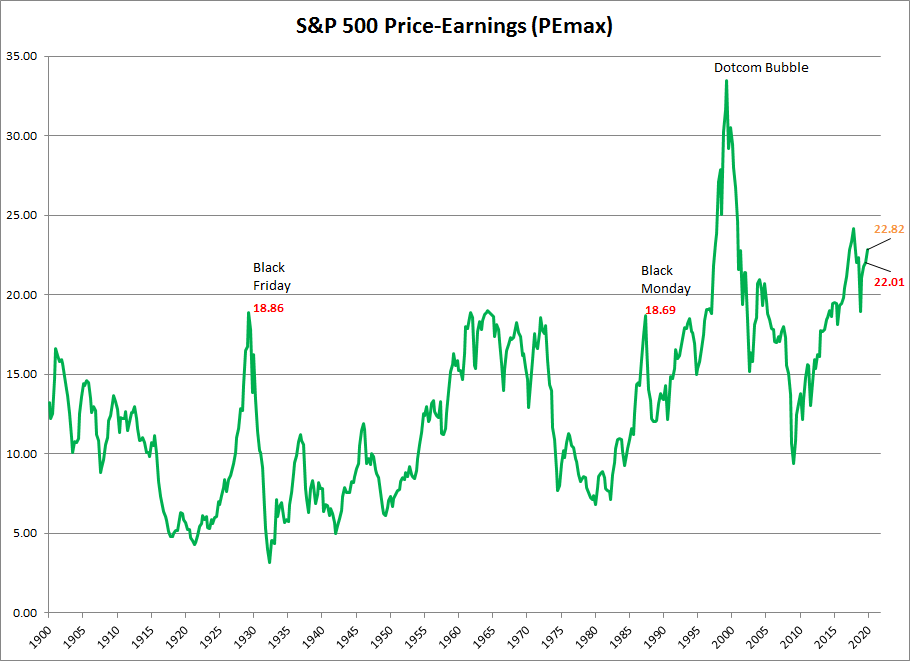
That is significantly higher than the peak earnings multiples achieved before previous crashes — 18.86 of October 1929 and 18.69 in October 1987 — and is only surpassed by the massive spike of the Dotcom bubble.
How could this end?
First, if the Fed withdraws (or makes any move to withdraw) the $750 billion temporary liquidity injection, intended to tide financial markets over the calendar year-end, I expect that the market would crash within minutes. They are unlikely to be that stupid but we should recognize that the funding is permanent, not temporary.
Second, if bond yields rise, P/E multiples are likely to fall. 10-Year breakout above 2.0% would signal an extended rise in yields.
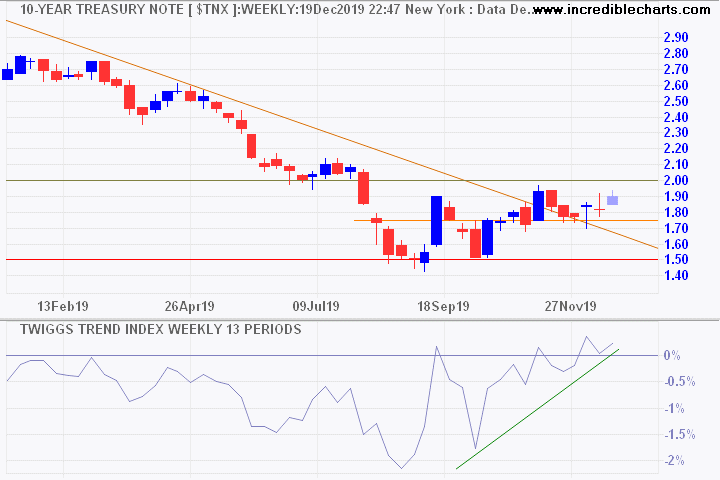
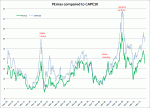
China has slowed its accumulation of US Dollar reserves, allowing the Yuan to strengthen against the Dollar (or at least weaken at a slower rate). Reduced Treasury purchases are causing yields to rise. The chart below shows in recent months how Treasury yields have tracked the Yuan/US Dollar (CNYUSD) exchange rate.
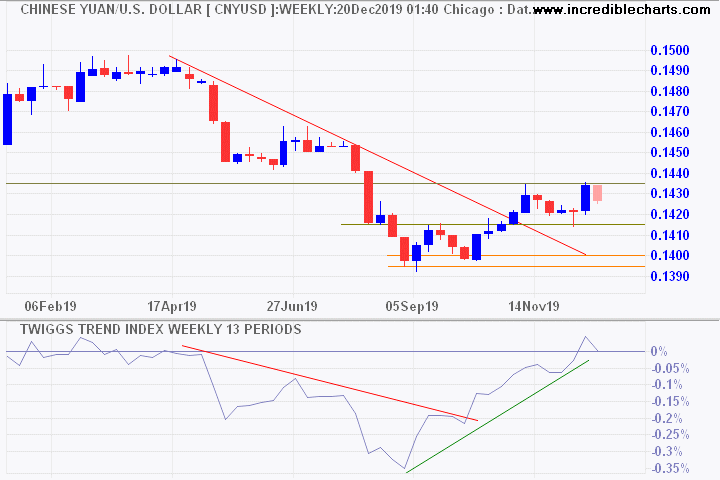
Accumulation of USD foreign exchange reserves (by China) is likely to be a central tenet of US trade deal negotiations � as they were with Japan in the 1985 Plaza Accord. Expect upward pressure on Treasury yields as growth in Chinese holdings slows and possibly even declines.
Third, and most importantly, are actual earnings. With 98.6% of S&P 500 companies having reported, earnings for the September quarter are 6.5% below the same quarter last year. Poor Fedex results and low economic growth warn of further poor earnings ahead.
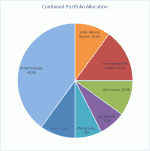
We maintain our view that stocks are over-priced and that investors need to exercise caution. We are over-weight cash and under-weight equities and will hold this position until normal P/E multiples are restored.
"There are three kinds of men.
The one that learns by reading.
The few who learn by observation.
The rest of them have to pee on the electric fence for themselves."
~ Will Rogers
More at The Patient Investor
-
Gold & Precious Metals
Gold remains bearish — patience is required. -
ASX 200
Hesitant because of Banks. -
China
Cracks are showing in China's debt markets. -
 Macro
Macro
Serious plumbing problems at the Fed. -
 The long game
Why the West is losing. ~ July 2, 2019 -
S&P 500
A good time to be cautious. ~ June 20, 2019 -
PEmax
Why you should be wary of Robert Shiller's CAPE. ~ January 15, 2019 -
Portfolio
Investing in a volatile market. ~ April 16, 2018
Disclaimer
Colin Twiggs is director of The Patient Investor Pty Ltd, an Authorised Representative (no. 1256439) of MoneySherpa Pty Limited which holds Australian Financial Services Licence No. 451289.
Everything contained in this web site, related newsletters, training videos and training courses (collectively referred to as the "Material") has been written for the purpose of teaching analysis, trading and investment techniques. The Material neither purports to be, nor is it intended to be, advice to trade or to invest in any financial instrument, or class of financial instruments, or to use any particular methods of trading or investing.
Advice in the Material is provided for the general information of readers and viewers (collectively referred to as "Readers") and does not have regard to any particular person's investment objectives, financial situation or needs. Accordingly, no Reader should act on the basis of any information in the Material without properly considering its applicability to their financial circumstances. If not properly qualified to do this for themselves, Readers should seek professional advice.
Investing and trading involves risk of loss. Past results are not necessarily indicative of future results.
The decision to invest or trade is for the Reader alone. We expressly disclaim all and any liability to any person, with respect of anything, and of the consequences of anything, done or omitted to be done by any such person in reliance upon the whole or any part of the Material.
Please read the Financial Services Guide.

Author: Colin Twiggs is a former investment banker with almost 40 years of experience in financial markets. He co-founded Incredible Charts and writes the popular Trading Diary and Patient Investor newsletters.
Using a top-down approach, Colin identifies key macro trends in the global economy before evaluating selected opportunities using a combination of fundamental and technical analysis.
Focusing on interest rates and financial market liquidity as primary drivers of the economic cycle, he warned of the 2008/2009 and 2020 bear markets well ahead of actual events.
He founded PVT Capital (AFSL No. 546090) in May 2023, which offers investment strategy and advice to wholesale clients.