A significant divergence
By Colin Twiggs
December 20, 2018 2:00 a.m. ET (6:00 p.m. AEDT)
First, please read the Disclaimer.
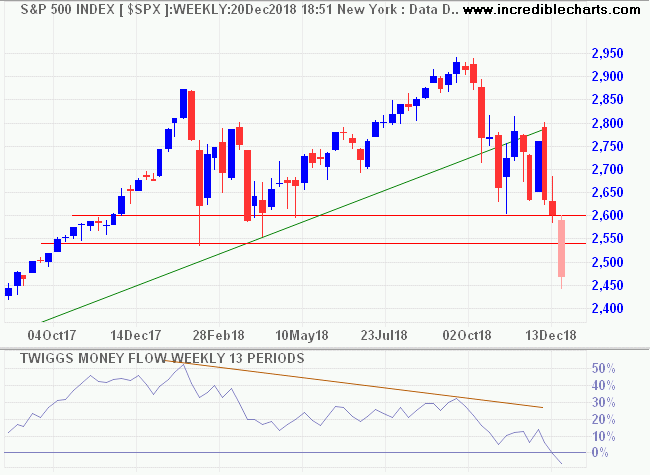
Market commentators are sifting through the data, looking for reasons to explain the sharp sell-off in stocks over the last two months. But everything they examine is likely to be shaded by their bear-tinted spectacles after the S&P 500 broke primary support at 2550.
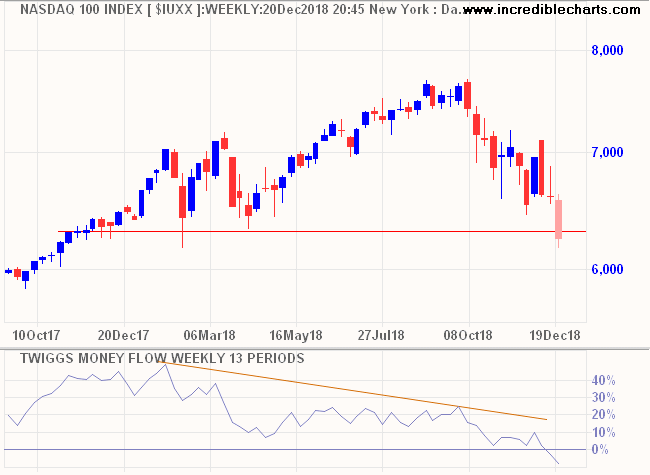
The Nasdaq 100 also broke primary support, confirming the bear market.
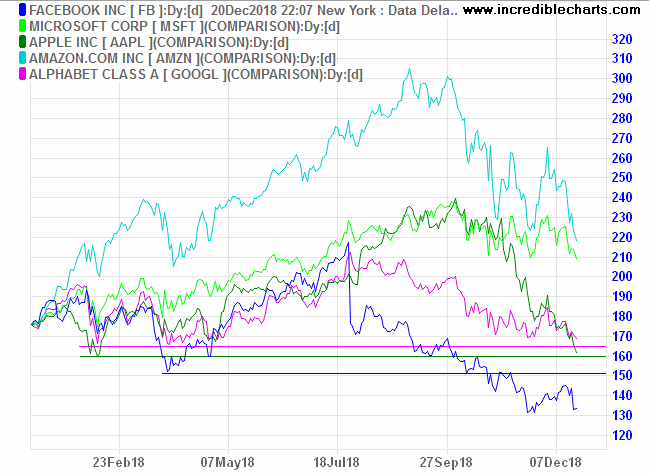
Of the big five tech stocks, Apple and Google are both testing primary support, threatening to follow Facebook into a primary down-trend. If the two break primary support, that would further strengthen the bear signal.
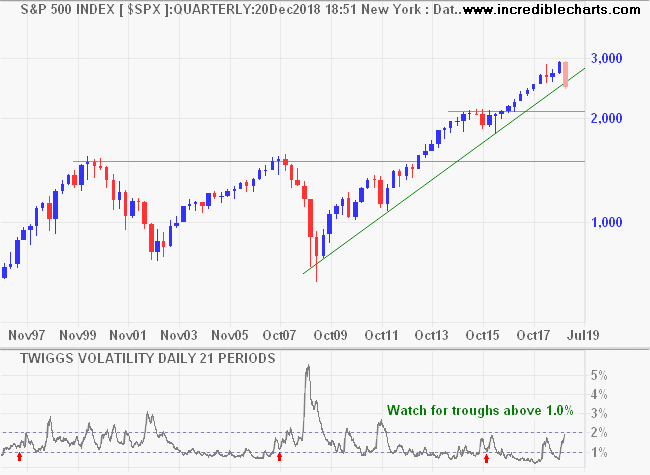
Volatility (21-day) is now close to 2% but the key is how volatility behaves on the next multi-week rally. If volatility forms a trough above 1% that would confirm the elevated risk.
Divergence? What Divergence?
Why do I say there is a significant divergence? Look at the fundamentals.
Fedex has just released stats for its most recent quarter, ended November 30. Package volumes are rising, not falling.
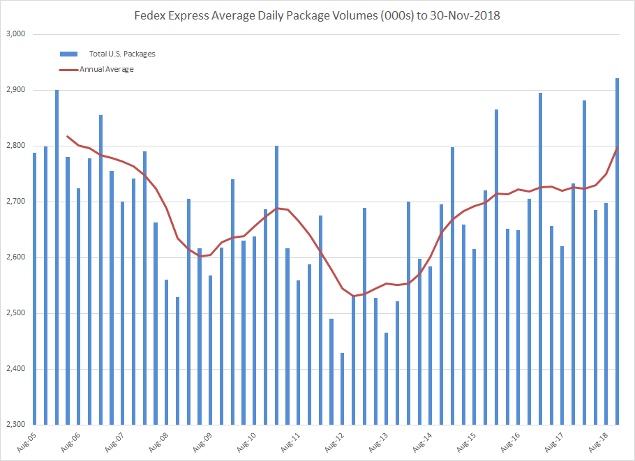
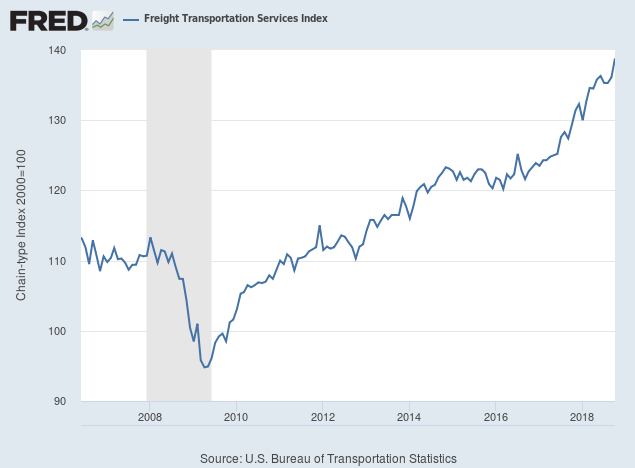
Supported by a very bullish Freight Transportation Index.
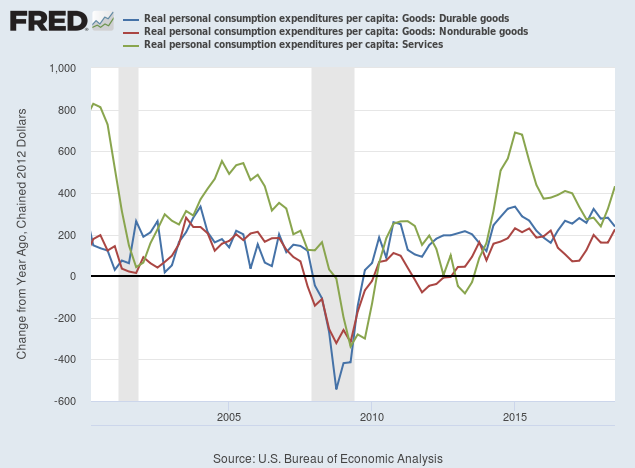
Consumption is strong, with Services and Non-durable goods rebounding. No sign of a recession here.
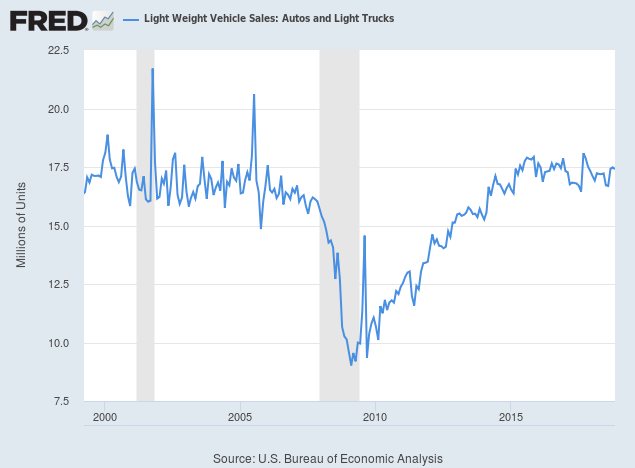
Light vehicle sales are at a robust annual rate of 17.5 million.
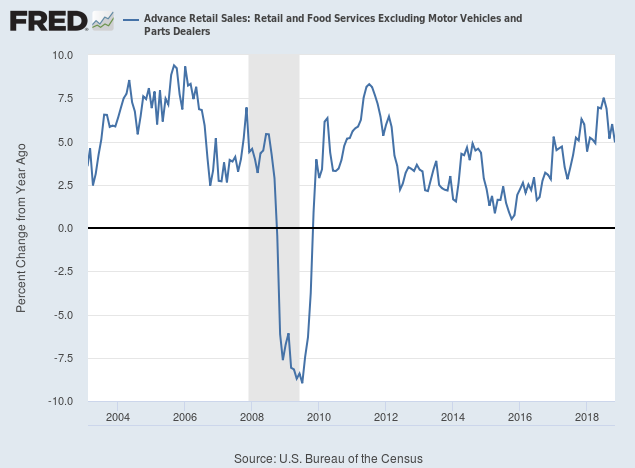
Retail sales growth (ex motor vehicles and parts) weakened in the last month but is still in an up-trend.
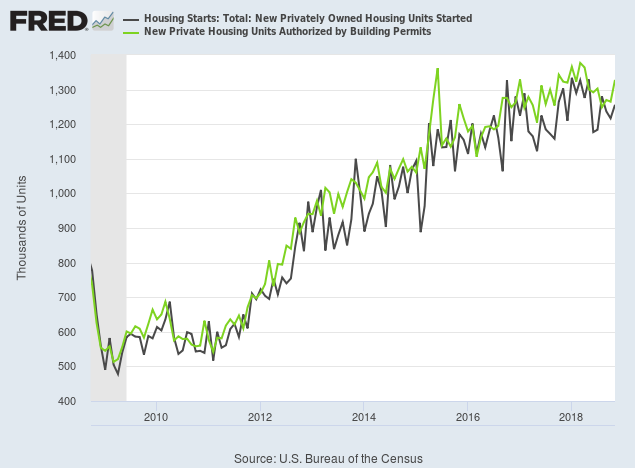
Housing starts and authorizations are still climbing.
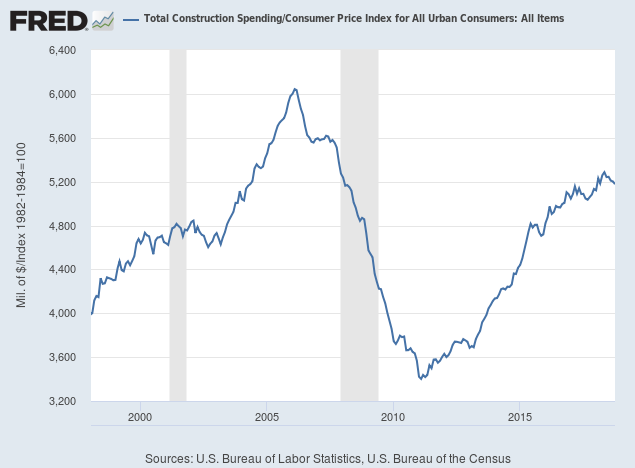
Real construction spending (adjusted by CPI) is strong.
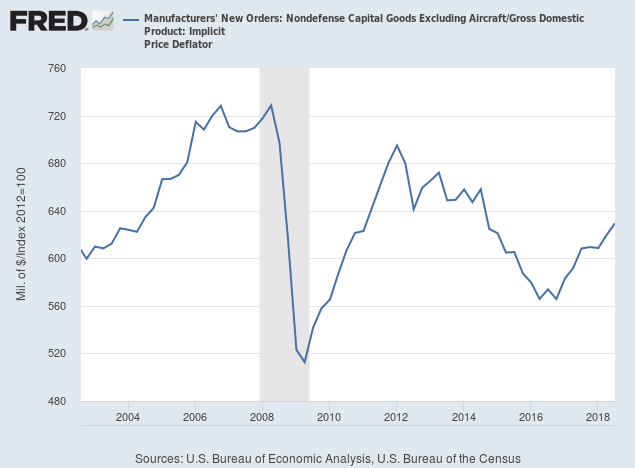
Manufacturers new orders (ex defense and aircraft) have rebounded after a weak 2015 - 2016.
Corporate investment is growing at a faster rate than the economy, with rising new capital formation over GDP.

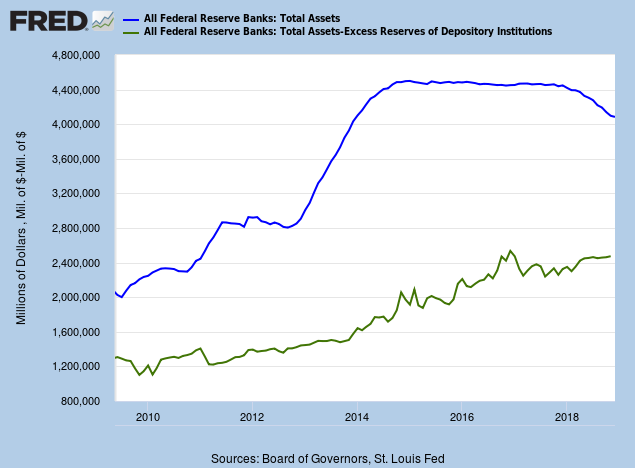
The Fed is shrinking its balance sheet which is expected to impact on liquidity. But commercial banks are running down excess reserves on deposit at the Fed at a faster rate, so that Fed assets net of excess reserves (green line) is actually rising. Hardly a drain on liquidity.
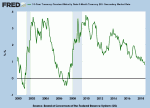
Market pundits are watching the yield curve with bated breath, waiting for the 10-year to cross below the 2-year yield.
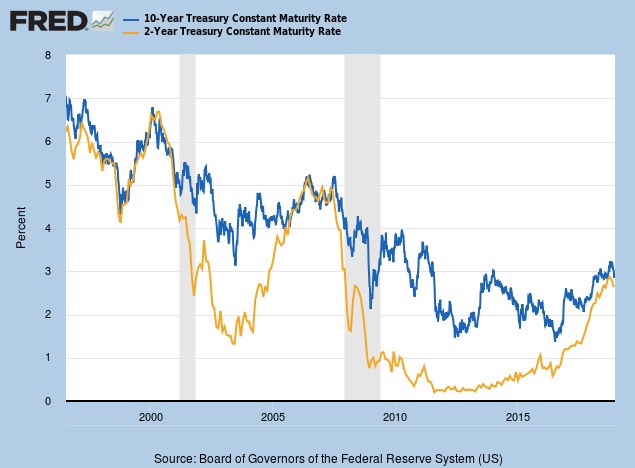
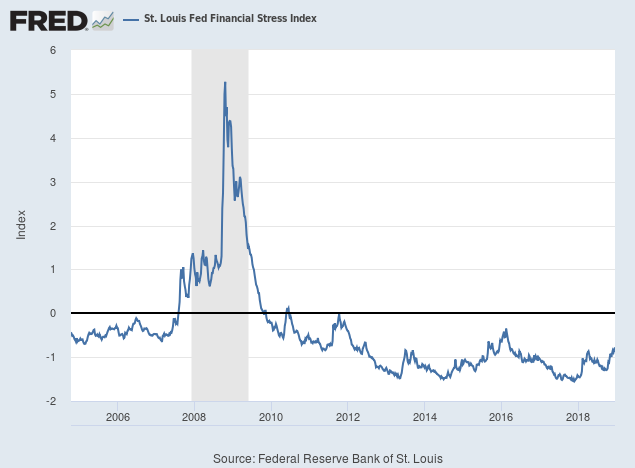
In the past this has served as a reliable early warning, normally 12 to 24 months ahead of a recession. But the St Louis Fed Financial Stress Index is well below zero, signaling an accommodative financial environment.
Why the mismatch? Fed actions — QE, Operation Twist, and even steps to shrink its balance sheet — have all suppressed long-term interest rates. We need to be wary of taking signals from a distorted yield curve.
Why have stocks reacted?
This is not a Pollyanna outlook. Never argue with the tape — we are clearly in a bear market. So why are stocks diverging from the economy?
The answer is China.
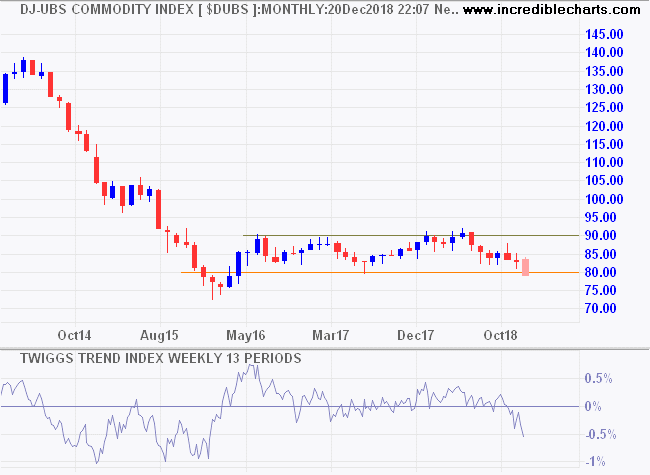
The impact of a trade war with the US would most likely cause a recession in China. Oil prices are already plunging in anticipation of falling demand.
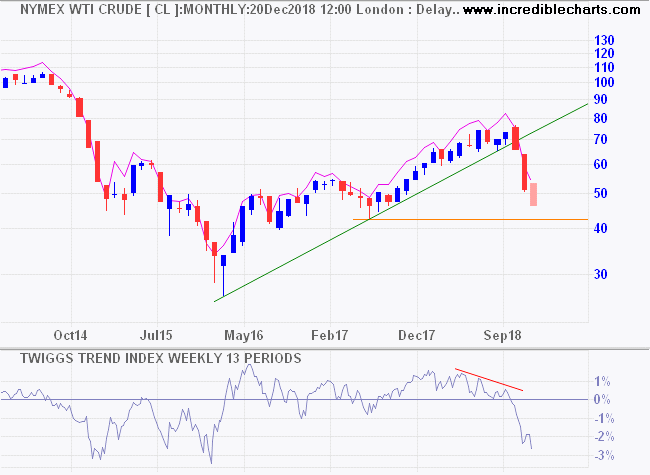
Commodities are likely to follow.
The impact of a Chinese recession would be felt around the globe. Europe has its own problems and could easily follow.
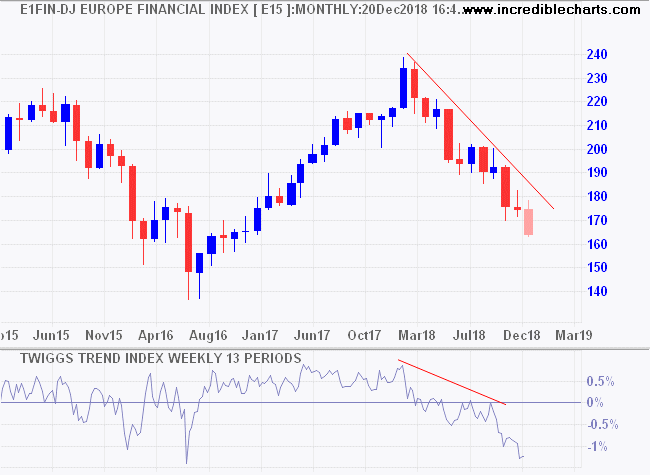
The US is likely to emerge relatively unscathed but Wall Street is going to be exceedingly cautious until some semblance of normality is restored.
I do not suggest selling all your stocks but make sure that there is enough cash in the portfolio to take advantage of opportunities when they arise.
When you look for the bad in mankind expecting to find it, you surely will.
~ Eleanor H Porter, Pollyanna
Latest
-
 Stock Screens
Mark Minervini's trend Template. -
ASX 200
Weighed down by banks. -

Making Rational Decisions
If it's flooded, forget it. -
Yield Curve
Does the yield curve warn of a recession?
Disclaimer
Colin Twiggs is director of The Patient Investor Pty Ltd, an Authorised Representative (no. 1256439) of MoneySherpa Pty Limited which holds Australian Financial Services Licence No. 451289.
Everything contained in this web site, related newsletters, training videos and training courses (collectively referred to as the "Material") has been written for the purpose of teaching analysis, trading and investment techniques. The Material neither purports to be, nor is it intended to be, advice to trade or to invest in any financial instrument, or class of financial instruments, or to use any particular methods of trading or investing.
Advice in the Material is provided for the general information of readers and viewers (collectively referred to as "Readers") and does not have regard to any particular person's investment objectives, financial situation or needs. Accordingly, no Reader should act on the basis of any information in the Material without properly considering its applicability to their financial circumstances. If not properly qualified to do this for themselves, Readers should seek professional advice.
Investing and trading involves risk of loss. Past results are not necessarily indicative of future results.
The decision to invest or trade is for the Reader alone. We expressly disclaim all and any liability to any person, with respect of anything, and of the consequences of anything, done or omitted to be done by any such person in reliance upon the whole or any part of the Material.
Please read the Financial Services Guide.

Author: Colin Twiggs is a former investment banker with almost 40 years of experience in financial markets. He co-founded Incredible Charts and writes the popular Trading Diary and Patient Investor newsletters.
Using a top-down approach, Colin identifies key macro trends in the global economy before evaluating selected opportunities using a combination of fundamental and technical analysis.
Focusing on interest rates and financial market liquidity as primary drivers of the economic cycle, he warned of the 2008/2009 and 2020 bear markets well ahead of actual events.
He founded PVT Capital (AFSL No. 546090) in May 2023, which offers investment strategy and advice to wholesale clients.