Market Volatility and the S&P 500
By Colin Twiggs
February 9, 2017 11:00 p.m. EST (3:00 p.m. AEDT)
Please read the Disclaimer.
It was clear from investment managers' comments at the start of the year — even Jeremy Grantham's meltup — that most expected a rally followed by an adjustment later in the year or early next year.
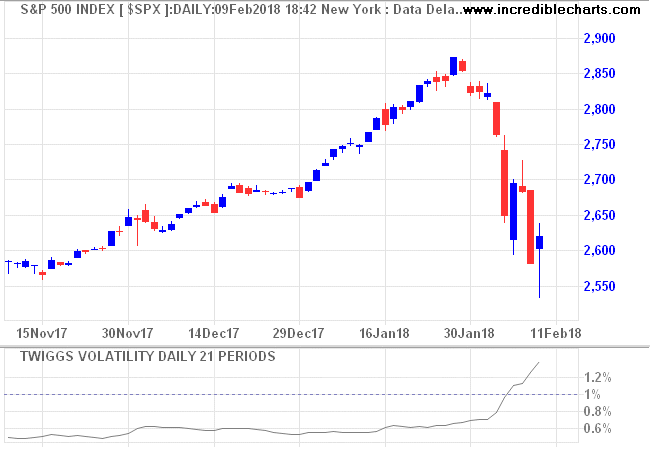
Valuations are high and the focus has started to swing away from making further gains and towards protecting existing profits. The size of this week's candles reflect the extent of the panic as gains patiently accumulated over several months evaporated in a matter of days.
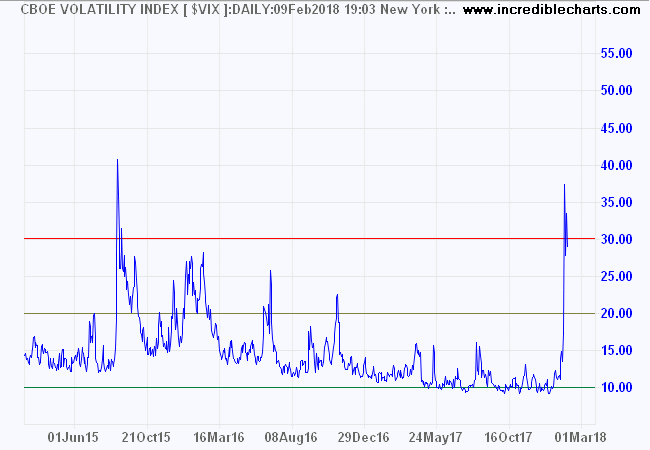
Volatility spiked, with the VIX jumping from record lows to above the red line at 30.
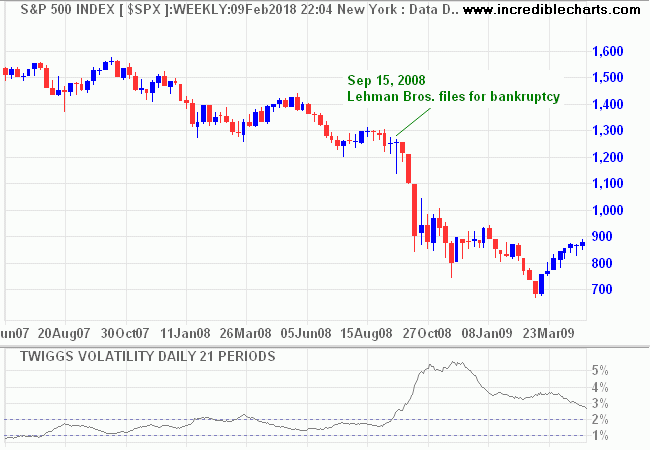
VIX reflects the short-term, emotional reaction to events in the market but tends to be unreliable as an indicator of long-term sentiment. I prefer my own Volatility indicator which highlights the gradual change in market outlook. The chart below shows how Volatility rose gradually from mid-2007, exceeding 2% by early 2008 then settled in an elevated range above 1% until the collapse of Lehman Bros sparked panic.
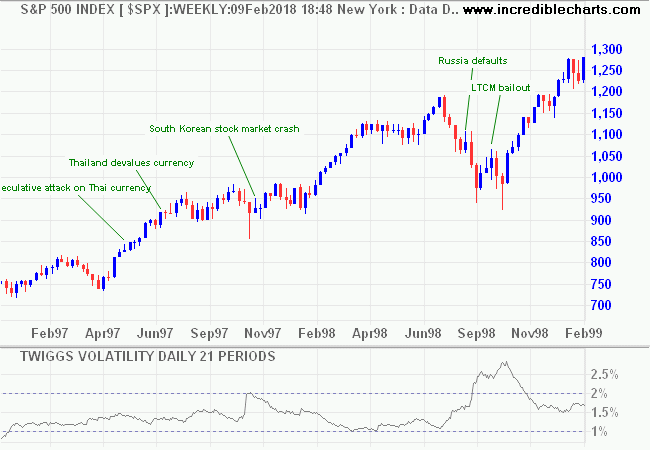
The emerging market crisis of 1998 shows a similar pattern. An elevated range in 1997 as the currency crisis grew was followed by a brief spike above 2% before another long, elevated range and then another larger spike with the Russian default.
The key is not to wait for Volatility to spike above 2%. By then it is normally too late. An alternative strategy would be to scale back positions when the market remains in an elevated range, between 1% and 2%, over several months. Many traders would argue that this is too early. But the signal does indicate elevated market risk and I am reasonably certain that investors with large positions would prefer to exit too early rather than too late.
So where are we now?
Volatility on the S&P 500 spiked up after an extended period below 1%. If Volatility retreats below 1% then the extended period of low market risk is likely to continue. If not, it will warn that market risk is elevated. Should that continue for more than a few weeks I would consider it time to start scaling back positions.
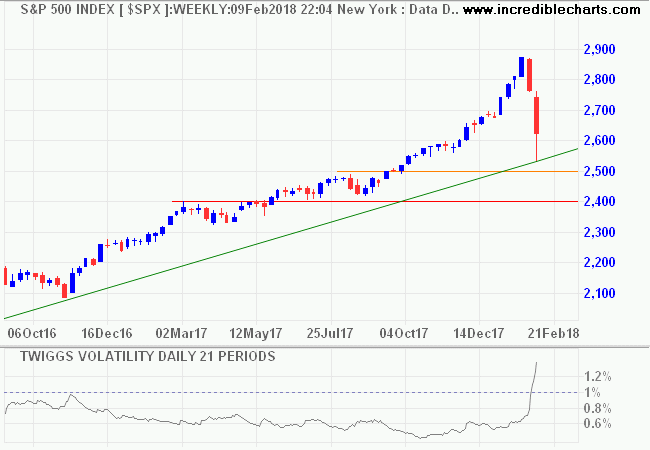
Only if we see a further spike above 2% would I act with any urgency.
The sucker has always tried to get something for nothing, and the appeal in all booms is always frankly to the gambling instinct aroused by cupidity and spurred by a pervasive prosperity. People who look for easy money invariably pay for the privilege of proving conclusively that it cannot be found on this sordid earth.
~ Jesse Livermore
Disclaimer
Colin Twiggs is director of The Patient Investor Pty Ltd, an Authorised Representative (no. 1256439) of MoneySherpa Pty Limited which holds Australian Financial Services Licence No. 451289.
Everything contained in this web site, related newsletters, training videos and training courses (collectively referred to as the "Material") has been written for the purpose of teaching analysis, trading and investment techniques. The Material neither purports to be, nor is it intended to be, advice to trade or to invest in any financial instrument, or class of financial instruments, or to use any particular methods of trading or investing.
Advice in the Material is provided for the general information of readers and viewers (collectively referred to as "Readers") and does not have regard to any particular person's investment objectives, financial situation or needs. Accordingly, no Reader should act on the basis of any information in the Material without properly considering its applicability to their financial circumstances. If not properly qualified to do this for themselves, Readers should seek professional advice.
Investing and trading involves risk of loss. Past results are not necessarily indicative of future results.
The decision to invest or trade is for the Reader alone. We expressly disclaim all and any liability to any person, with respect of anything, and of the consequences of anything, done or omitted to be done by any such person in reliance upon the whole or any part of the Material.
Recent Posts

Author: Colin Twiggs is a former investment banker with almost 40 years of experience in financial markets. He co-founded Incredible Charts and writes the popular Trading Diary and Patient Investor newsletters.
Using a top-down approach, Colin identifies key macro trends in the global economy before evaluating selected opportunities using a combination of fundamental and technical analysis.
Focusing on interest rates and financial market liquidity as primary drivers of the economic cycle, he warned of the 2008/2009 and 2020 bear markets well ahead of actual events.
He founded PVT Capital (AFSL No. 546090) in May 2023, which offers investment strategy and advice to wholesale clients.

