What does falling job growth indicate?
By Colin Twiggs
September 1, 2017 9:30 p.m. EDT (11:30 p.m. AEST)
Please note changes to the Disclaimer
Colin Twiggs is a director of The Patient Investor Pty Ltd, an Authorised Representative (no. 1256439) of MoneySherpa Pty Limited which holds Australian Financial Services Licence No. 451289.
Everything contained in this web site, related newsletters, training videos and training courses (collectively referred to as the "Material") has been written for the purpose of teaching analysis, trading and investment techniques. The Material neither purports to be, nor is it intended to be, advice to trade or to invest in any financial instrument, or class of financial instruments, or to use any particular methods of trading or investing.
Advice in the Material is provided for the general information of readers and viewers (collectively referred to as "Readers") and does not have regard to any particular person's investment objectives, financial situation or needs. Accordingly, no Reader should act on the basis of any information in the Material without properly considering its applicability to their financial circumstances. If not properly qualified to do this for themselves, Readers should seek professional advice.
Investing and trading involves risk of loss. Past results are not necessarily indicative of future results.
The decision to invest or trade is for the Reader alone. We expressly disclaim all and any liability to any person, with respect of anything, and of the consequences of anything, done or omitted to be done by any such person in reliance upon the whole or any part of the Material.
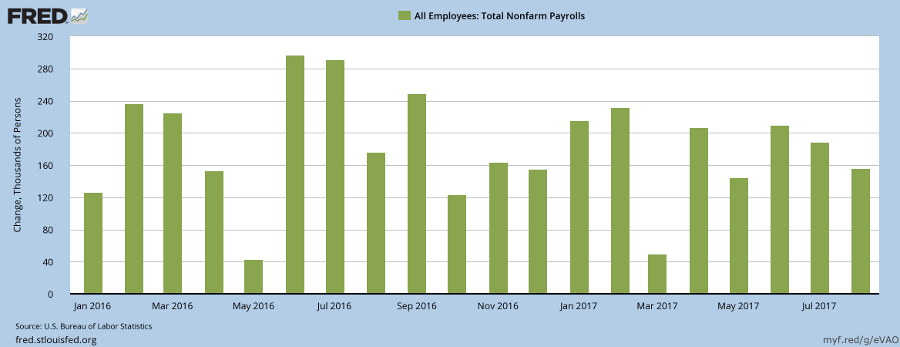
Job growth fell to 156,000 for August, from a high of 210,000 in June, according to the latest BLS stats.
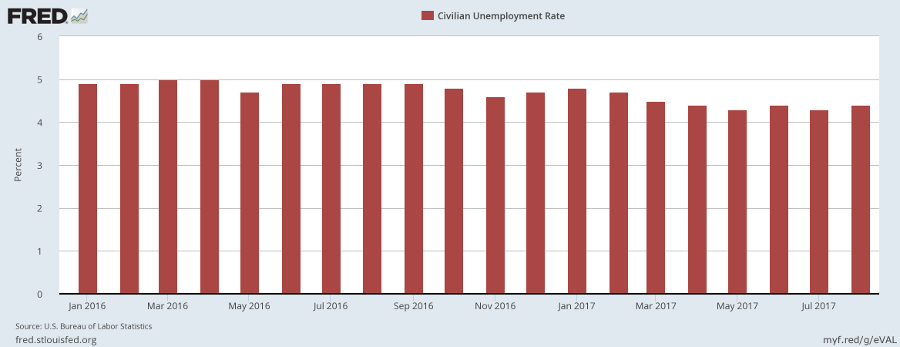
Unemployment ticked up from 4.3% to 4.4% for August.
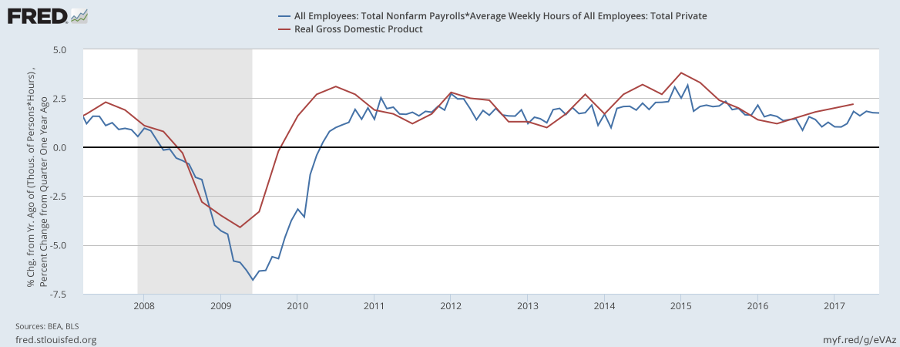
What does this mean? Very little, if we look at our real GDP forecast based on total nonfarm payroll multiplied by average weekly hours worked. GDP growth is slow but steady.
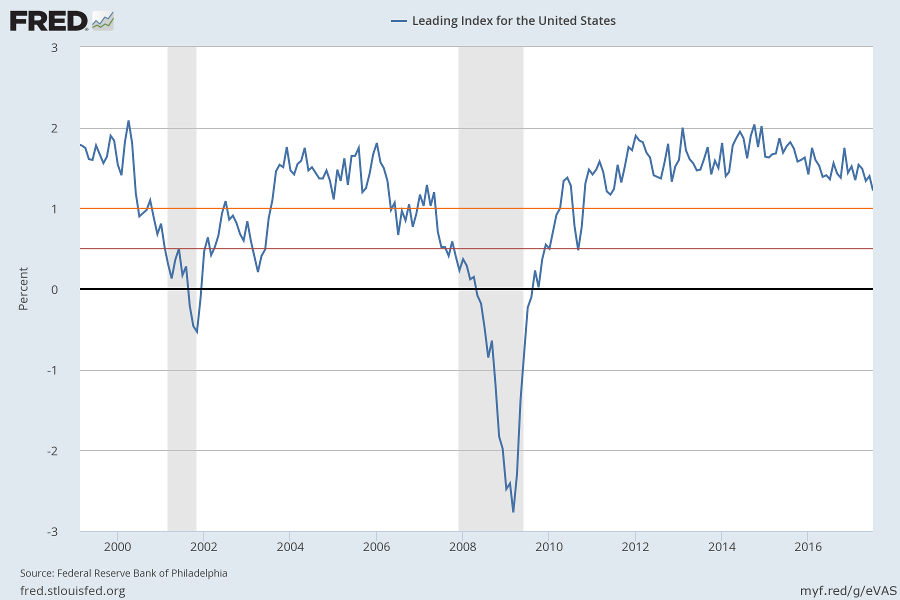
The recently published Philadelphia Fed Leading Index for July has slowed but remains comfortably above the early warning level of 1. The index normally falls below 0.5 in the months ahead of a recession.
The S&P 500 is testing resistance at 2480 after a weak correction that respected support at 2400. Bearish divergence on Twiggs Money Flow continues to warn of selling pressure but this seems secondary in nature. Breakout above 2480 is likely and would offer a target of 2540*.
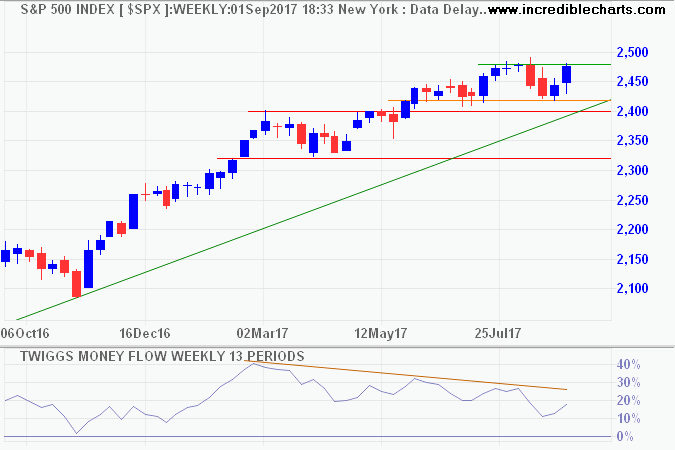
Target 2480 + ( 2480 - 2420 ) = 2540
The Nasdaq 100 is testing resistance at its all-time high of 6000. Bearish divergence on Twiggs Money Flow again warns of secondary selling pressure. Breakout would offer a short-term target of 6250 and a long-term target of 7000.
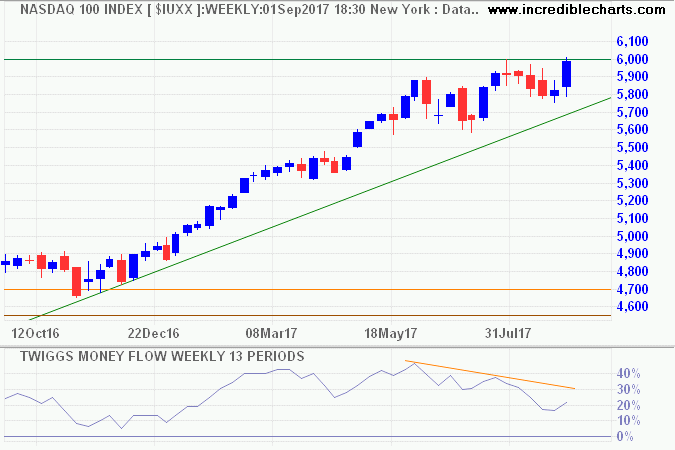
Target 6000 + ( 6000 - 5750 ) = 6250
The bull market remains on track for further gains.
If you want to have a better performance than the crowd, you must do things differently from the crowd.
~ Sir John Templeton

Author: Colin Twiggs is a former investment banker with almost 40 years of experience in financial markets. He co-founded Incredible Charts and writes the popular Trading Diary and Patient Investor newsletters.
Using a top-down approach, Colin identifies key macro trends in the global economy before evaluating selected opportunities using a combination of fundamental and technical analysis.
Focusing on interest rates and financial market liquidity as primary drivers of the economic cycle, he warned of the 2008/2009 and 2020 bear markets well ahead of actual events.
He founded PVT Capital (AFSL No. 546090) in May 2023, which offers investment strategy and advice to wholesale clients.
