Nasdaq & S&P 500 meet resistance, Australia: Housing, Incomes & Growth
By Colin Twiggs
August 04, 2017 9:30 p.m. EDT (11:30 a.m. AEST)
Disclaimer
Please read the Disclaimer. I am not a licensed investment adviser.
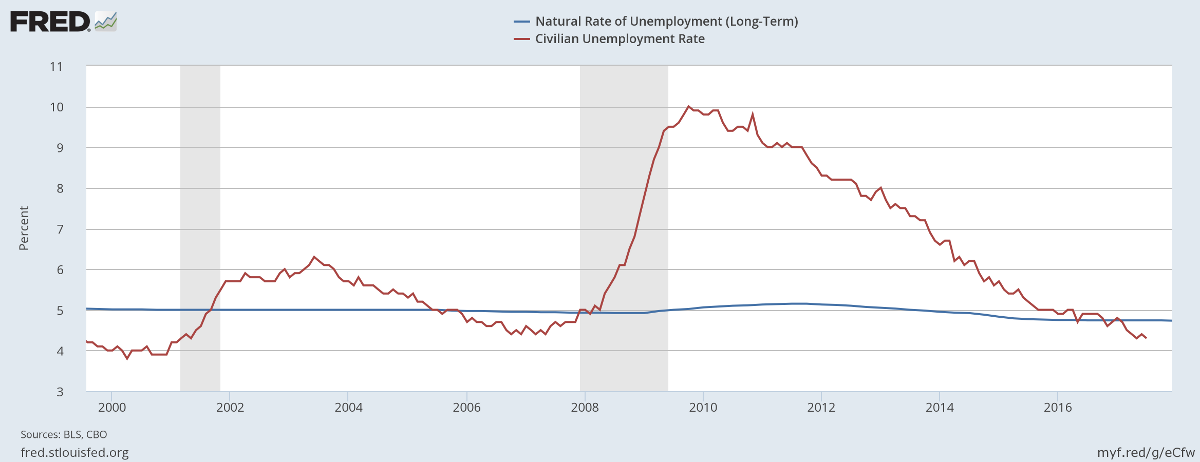
July labor stats are out and show the jobless rate fell to a 16-year low at 4.3%. Unemployment below the long-term natural rate suggests the economy is close to capacity and inflationary pressures should be building.
Source: St Louis Fed, BLS
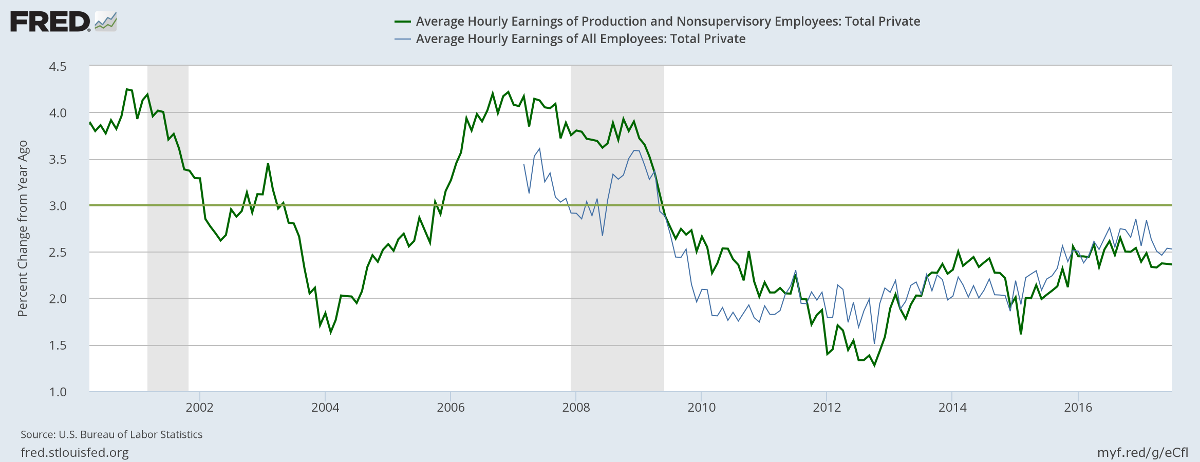
But hourly wage rates are growing at a modest pace, easing pressure on the Fed to raise interest rates.
Source: St Louis Fed, BLS
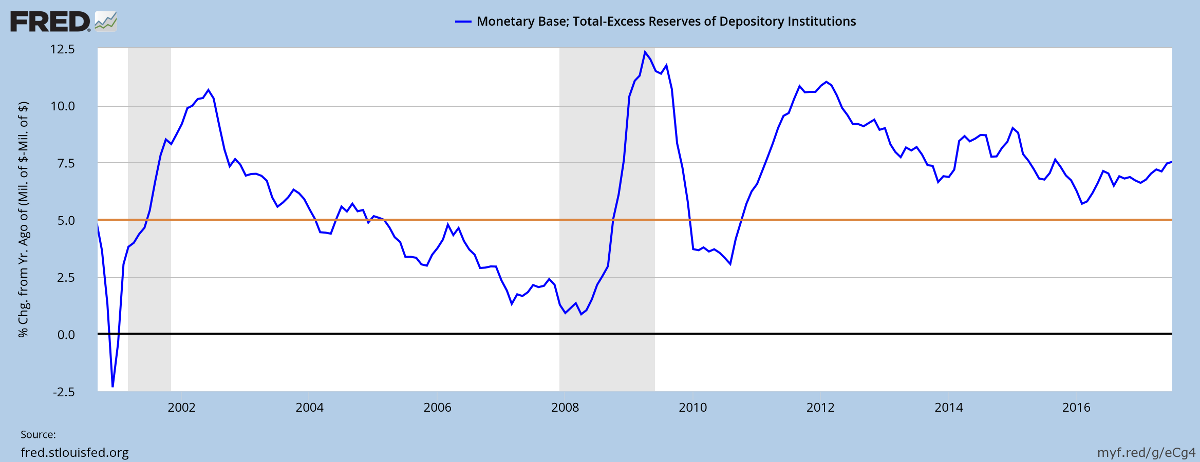
Fed monetary policy remains accommodative, with the monetary base (net of excess reserves) growing at a robust 7.5% a year.
Source: St Louis Fed, FRB
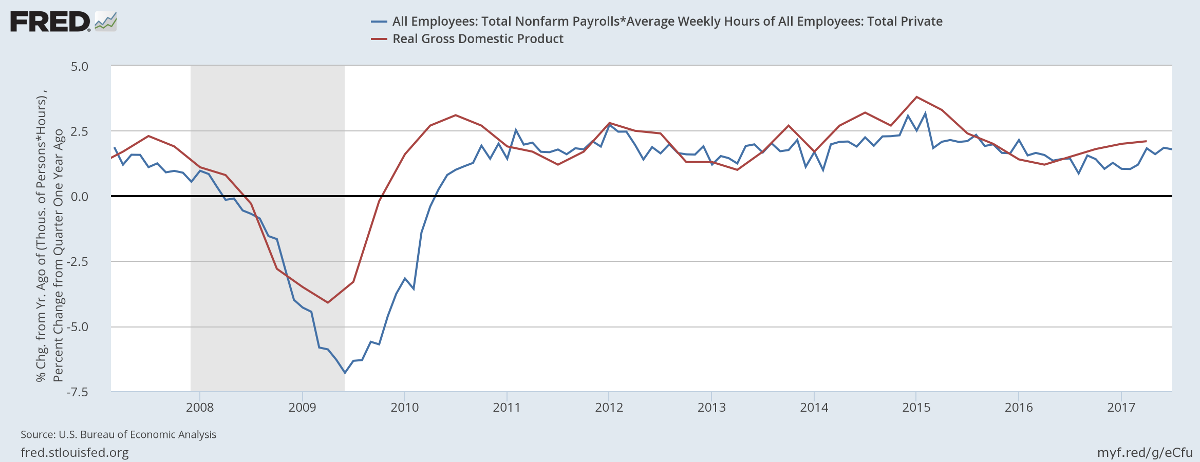
Our forward estimate of real GDP — Nonfarm Payroll * Average Weekly Hours — continues at a slow but steady annual pace of 1.79%.
Source: St Louis Fed, BLS & BEA
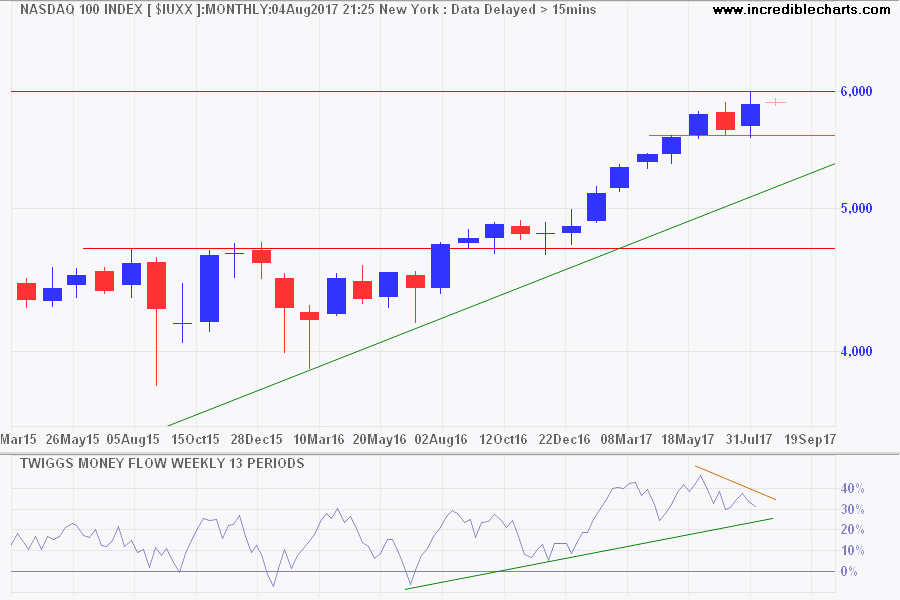
The Nasdaq 100 has run into resistance at 6000. No doubt readers noticed Amazon [AMZN] and Alphabet [GOOG] both retreated after reaching the $1000 mark. This is natural. Correction back to the rising trendline would take some of the heat out of the market and provide a solid base for further gains. Selling pressure, reflected by declining peaks on Twiggs Money Flow, appears secondary.
The S&P 500 is also running into resistance, below 2500. Bearish divergence on Twiggs Money Flow warns of moderate selling pressure but this again seems to be secondary — in line with a correction rather than a reversal.
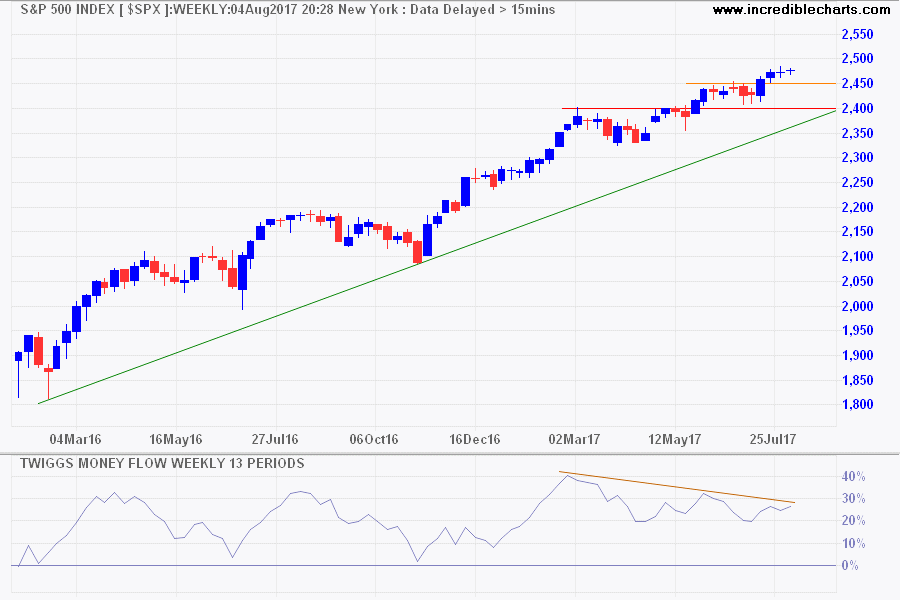
Target 2400 + ( 2400 - 2300 ) = 2500
Australia: Housing, Incomes & Growth
A quick snapshot of the Australian economy from the latest RBA chart pack.
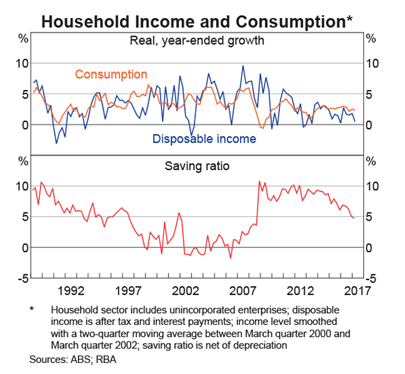
Disposable income growth has declined to almost zero and consumption is likely to follow. Else Savings will be depleted.
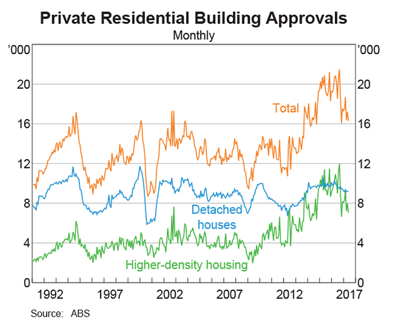
Residential building approvals are slowing, most noticeably in apartments, reflecting an oversupply.
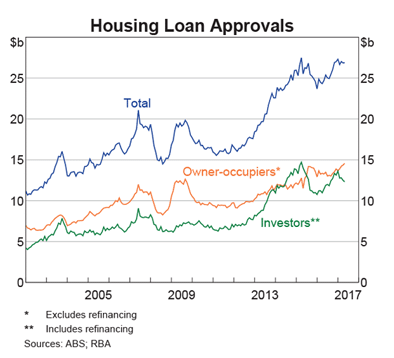
Housing loan approvals for owner-occupiers are rising, fueled no doubt by State first home-buyer incentives. States do not want the party, especially the flow from stamp duties, to end. But loan approvals for investors are topping after an APRA crack down on investor mortgages, especially interest-only loans.
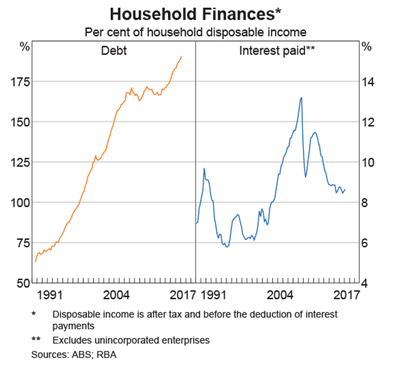
The ratio of household debt to disposable income is precarious, and growing worse with each passing year.
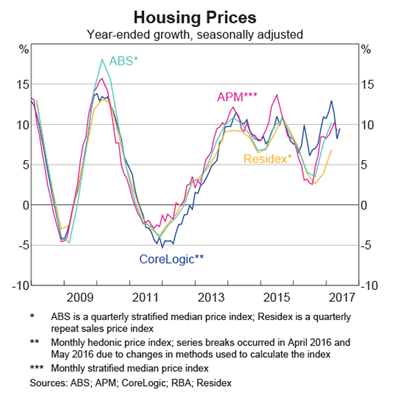
House price growth continues at close to 10% a year, fueled by rising debt. When we refer to the "housing bubble" it is really a debt bubble driving housing prices. If debt growth slows so will housing prices.
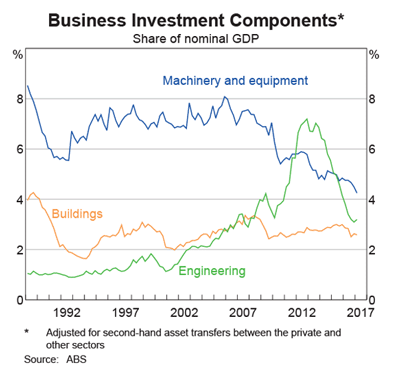
Declining business investment, as a percentage of GDP, warns of slowing economic growth in the years ahead. It is difficult, if not impossible, to achieve productivity growth without continuous new investment and technology improvement.
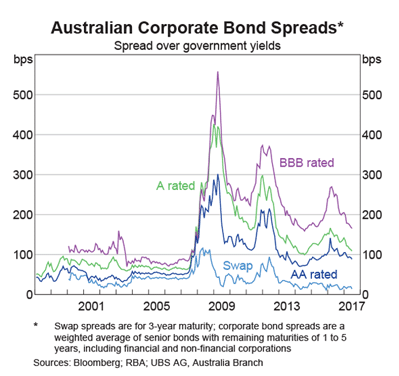
Yet declining corporate bond spreads show no sign of increased lending risk.
Declining disposable income and consumption growth mean that voters are unlikely to be happy come next election. With each party trying to ride the populist wave, responsible economic management has taken a back seat. Throw in a housing bubble and declining business investment and the glass looks more than half-empty.
Every great cause begins as a movement, becomes a business, and eventually degenerates into a racket.
~ Eric Hoffer

Author: Colin Twiggs is a former investment banker with almost 40 years of experience in financial markets. He co-founded Incredible Charts and writes the popular Trading Diary and Patient Investor newsletters.
Using a top-down approach, Colin identifies key macro trends in the global economy before evaluating selected opportunities using a combination of fundamental and technical analysis.
Focusing on interest rates and financial market liquidity as primary drivers of the economic cycle, he warned of the 2008/2009 and 2020 bear markets well ahead of actual events.
He founded PVT Capital (AFSL No. 546090) in May 2023, which offers investment strategy and advice to wholesale clients.
