What's New: How to Screen for Trends with Twiggs Money Flow & Twiggs Momentum
By Colin Twiggs
May 16, 2017 3:00 a.m. EDT (5:00 p.m. AEST)
In a recent newsletter I highlighted a strategy for trading trends using Bollinger Bands and Twiggs Money Flow. This included a warning that strategies like this should only be used with strong trends as whipsaws would prove expensive.
Last week I showed how to use the stock screener to highlight suitable stocks. You will find the screen saved as #90489 on the Shared tab. To open the Stock Screener, select Securities >> Stock Screens on the chart menu.
This week I discuss two further screens, using Twiggs Momentum & Twiggs Money Flow to highlight strong-trending stocks.
Combining Twiggs Momentum & Twiggs Money Flow
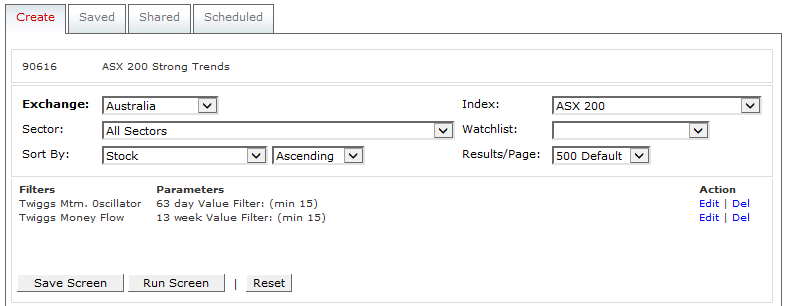
Twiggs Momentum highlights stocks in an established up-trend, while Twiggs Money Flow indicates buying or selling pressure. I combine the two indicators here to flag strong-trending stocks confirmed by strong buying pressure. The screen below is numbered #90616 on the Shared tab.

The equivalent screen for the S&P 500 is numbered #90620.
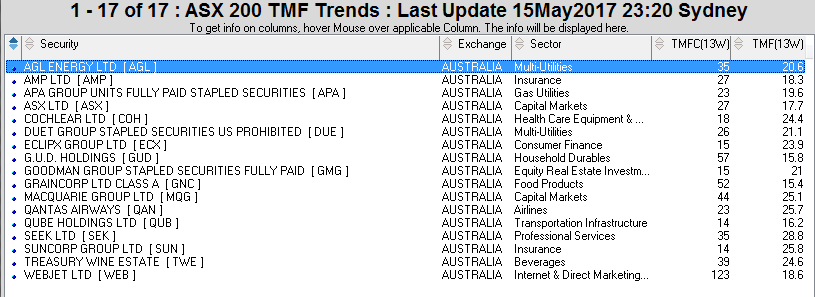
Results for the ASX screen are displayed below:

Screening with Twiggs Money Flow
The second screen, numbered #90740 on the Shared tab, attempts to highlight stocks earlier in the trend using only Twiggs Money Flow as a filter.

The first filter identifies stocks where Twiggs Money Flow (13-week) has remained above zero for at least 13 weeks, signaling sustained buying pressure. The second filters for stocks where Twiggs Money Flow (13-week) is greater than 15.0%, indicating buying pressure strength.
Comparing the Results
As expected, the second screen produces more results, but with many stocks common to both screens:

More importantly, the second scan produces results earlier in the up-trend.
Seek Ltd [SEK] is a typical stock thrown up by both screens. Orange arrows highlight where the first screen identifies the trend — when Twiggs Momentum crosses above 15.0% — after the breakout above resistance at $17.00.
![Seek Ltd [SEK] - Twiggs Momentum & Twiggs Money Flow Trend Seek Ltd [SEK] - Twiggs Momentum & Twiggs Money Flow Trend](https://www.incrediblecharts.com/images/stock_screen_images/sek-twiggsmomentum-trend.png)
The green arrow on Twiggs Money Flow below shows where the second scan first flags the stock. Rising Twiggs Money Flow with values above 15% indicates strong and sustained buying pressure.
![Seek Ltd [SEK] - Twiggs Money Flow Trend Seek Ltd [SEK] - Twiggs Money Flow Trend](https://www.incrediblecharts.com/images/stock_screen_images/sek-twiggsmoneyflow-trend.png)
The subsequent green arrow on the price chart indicates the entry point according to the Bollinger Band trend-following system.
By eliminating Twiggs Momentum as a filter, we may identify stocks earlier in the trend. But there is a trade-off: the earlier we enter the trend, the more prone it may be to failure.
Please note that stocks shown are for illustration purposes only and are not recommendations. Readers should conduct their own research.
Most of us spend too much time on what is urgent and not enough time on what is important.
~ Stephen Covey

Author: Colin Twiggs is a former investment banker with almost 40 years of experience in financial markets. He co-founded Incredible Charts and writes the popular Trading Diary and Patient Investor newsletters.
Using a top-down approach, Colin identifies key macro trends in the global economy before evaluating selected opportunities using a combination of fundamental and technical analysis.
Focusing on interest rates and financial market liquidity as primary drivers of the economic cycle, he warned of the 2008/2009 and 2020 bear markets well ahead of actual events.
He founded PVT Capital (AFSL No. 546090) in May 2023, which offers investment strategy and advice to wholesale clients.
