What's New: Screening for Bollinger Band Trends
By Colin Twiggs
May 08, 2017 3:00 a.m. EDT (5:00 p.m. AEST)
In my last newsletter I highlighted a strategy for trading trends using Bollinger Bands and Twiggs Money Flow.
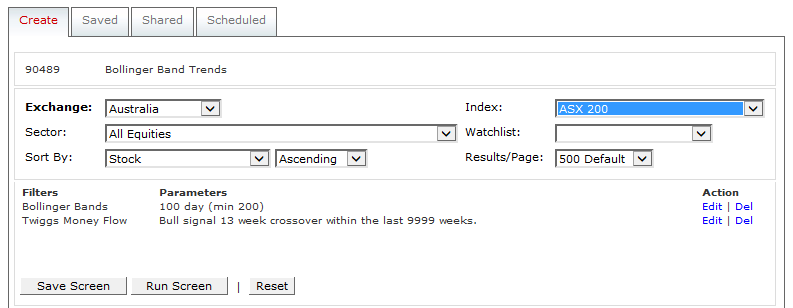
I have created a new stock screen to accompany this. You will find the screen saved as #90489 on the Shared tab:

"....within the last 9999 weeks" represents all weeks.
Click Edit to adapt the screen for use on other Exchanges (e.g. US) and Indices (e.g. S&P 500).
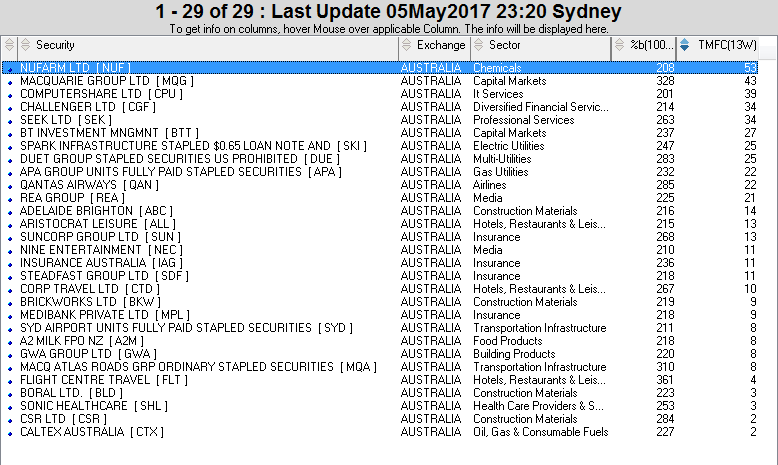
On the results page, click the TMFC header to order by the number of weeks Twiggs Money Flow (13-week) has been above zero.

- The %b column shows the number of standard deviations the stock is above the moving average (e.g. NUF value is 2.08 STD).
- The TMFC column displays the number of weeks Twiggs Money Flow has been above zero, a measure of buying pressure.
The first few stocks in the list are likely to be well-established trends that commenced some time ago.
![Computershare [CPU] - Bollinger Bands & Twiggs Money Flow Trend Computershare [CPU] - Bollinger Bands &: Twiggs Money Flow Trend](https://www.incrediblecharts.com/images/stock_screen_images/cpu_bollinger-twiggsmoneyflow-trend.png)
While others, further down the list, will display more recent breakouts.
![Medibank Private [MPL] - Bollinger Bands & Twiggs Money Flow Trend Medibank Private [MPL] - Bollinger Bands &: Twiggs Money Flow Trend](https://www.incrediblecharts.com/images/stock_screen_images/mpl_bollinger-twiggsmoneyflow-trend.png)
Please note that stocks shown are for illustration purposes only and are not recommendations. Readers should conduct their own research.
Here is a quick refresh of the Bollinger Bands/Twiggs Money Flow trading strategy.
I am not a product of my circumstances. I am a product of my decisions.
~ Stephen Covey

Author: Colin Twiggs is a former investment banker with almost 40 years of experience in financial markets. He co-founded Incredible Charts and writes the popular Trading Diary and Patient Investor newsletters.
Using a top-down approach, Colin identifies key macro trends in the global economy before evaluating selected opportunities using a combination of fundamental and technical analysis.
Focusing on interest rates and financial market liquidity as primary drivers of the economic cycle, he warned of the 2008/2009 and 2020 bear markets well ahead of actual events.
He founded PVT Capital (AFSL No. 546090) in May 2023, which offers investment strategy and advice to wholesale clients.
