Dow Descending Wedge
By Colin Twiggs
March 31, 2017 7:00 p.m. ET (10:00 a.m. AEDT)
Disclaimer
Please read the Disclaimer. I am not a licensed investment adviser.
Dow Jones Industrial Average displays a descending broadening wedge on the daily chart. Thomas Bulkowski describes this as a mid list performer "....found most often with upward breakouts in a bull market. Downward breakouts are quite rare."
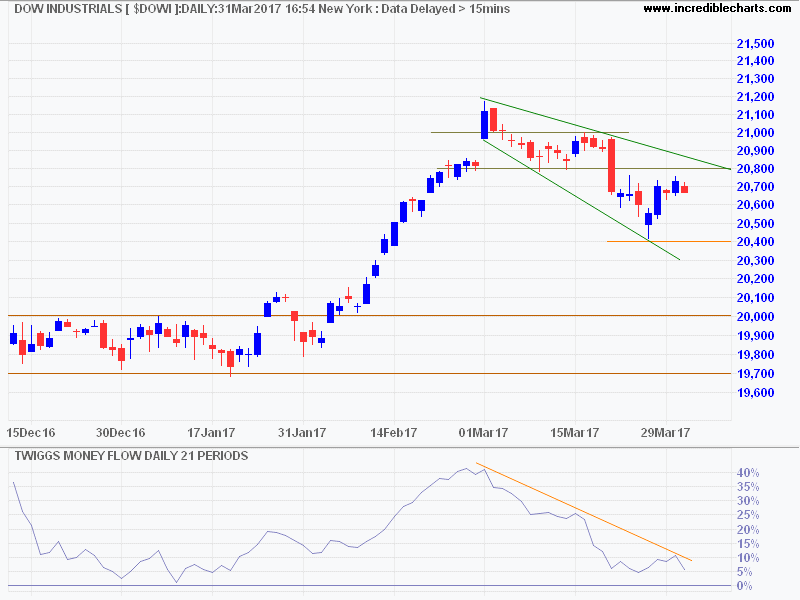
The correction seems mild and lacks urgency from sellers. It is very likely to end with an upward breakout, above the wedge at 20800, signaling another advance. Watch for a failed down-swing within the wedge pattern. According to empirical testing done by Bulkowski, a partial decline has a high probability (87%) of resolving in an upward breakout.
Latest GDP numbers confirm that low growth of the past decade continues.
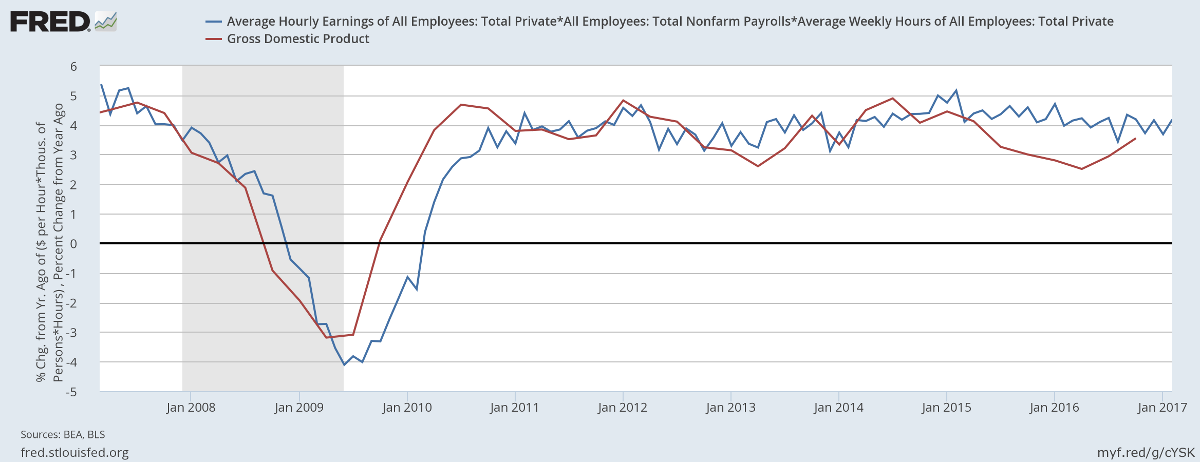
The quick rule-of-thumb forecast — Private sector employee payroll x Average Hours Worked x Average Hourly Rate — has proved remarkably accurate and has become one of my favorite indicators.
Australia
The ASX 200 broke through stubborn resistance at 5800 but is struggling to reach 6000.
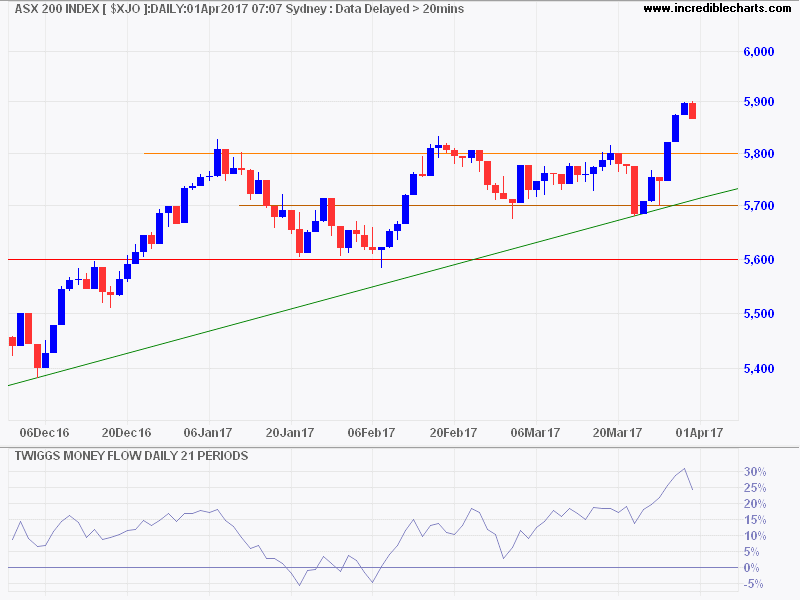
There are three headwinds that make me believe that the index will struggle to break 6000:
Shuttering of the motor industry
The last vehicles will roll off production lines in October this year. A 2016 study by Valadkhani & Smyth estimates the number of direct and indirect job losses at more than 20,000.

But this does not take into account the vacuum left by the loss of scientific, technology and engineering skills and the impact this will have on other industries.
...R&D-intensive manufacturing industries, such as the motor vehicle industry, play an important role in the process of technology diffusion. These findings are consistent with the argument in the Bracks report that R&D is a linchpin of the Australian automotive sector and that there are important knowledge spillovers to other industries.
Collapse of the housing bubble
An oversupply of apartments will lead to falling prices, with heavy discounting already evident in Melbourne as developers attempt to clear units. Bank lending will slow as prices fall and spillover into the broader housing market seems inevitable. Especially when:
- Current prices are supported by strong immigration flows which are bound to lead to a political backlash if not curtailed;
- The RBA is low on ammunition; and
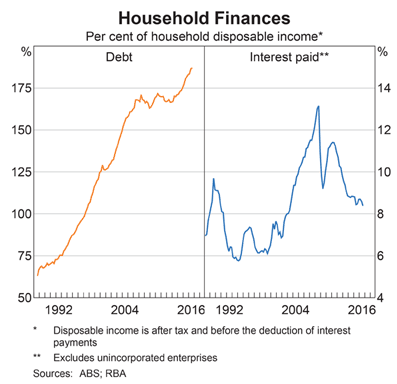
- Australian households are leveraged to the eyeballs — the highest level of Debt to Disposable Income of any OECD nation.
Falling demand for iron ore & coal
China is headed for a contraction, with a sharp down-turn in growth of M1 money supply warning of tighter liquidity. Falling housing prices and record iron ore inventory levels are both likely to drive iron ore and coal prices lower.
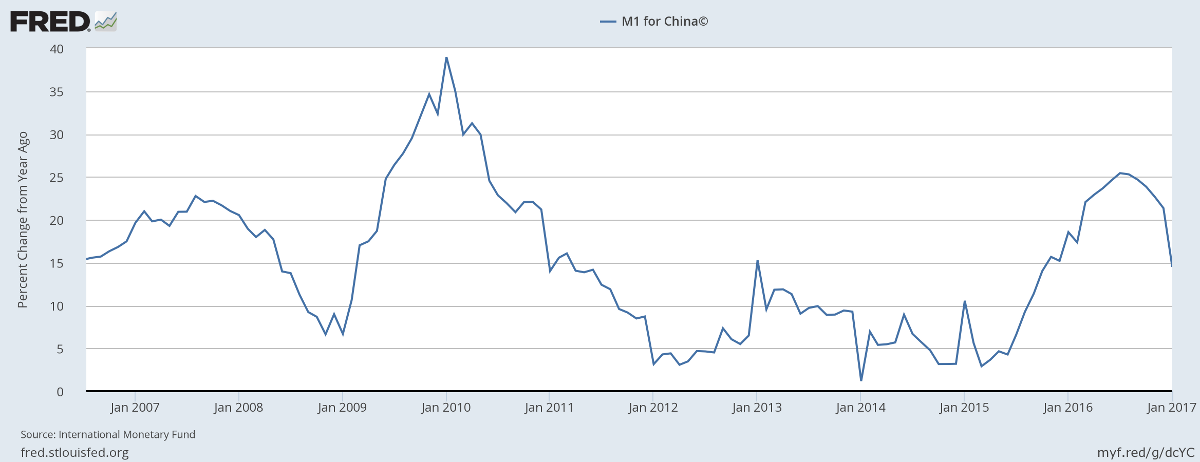
Current Mr Micawber style economic management has so far held good, with something always turning up at just the right moment — like the massive 2009-2010 stimulus on the chart above — to rescue the economy from disaster. But sooner or later our luck will run out. As any trader will tell you: Hope isn't a strategy.
"I have no doubt I shall, please Heaven, begin to be more beforehand with the world, and to live in a perfectly new manner, if — if, in short, anything turns up."
~ Wilkins Micawber from Charles Dickens' David Copperfield

Author: Colin Twiggs is a former investment banker with almost 40 years of experience in financial markets. He co-founded Incredible Charts and writes the popular Trading Diary and Patient Investor newsletters.
Using a top-down approach, Colin identifies key macro trends in the global economy before evaluating selected opportunities using a combination of fundamental and technical analysis.
Focusing on interest rates and financial market liquidity as primary drivers of the economic cycle, he warned of the 2008/2009 and 2020 bear markets well ahead of actual events.
He founded PVT Capital (AFSL No. 546090) in May 2023, which offers investment strategy and advice to wholesale clients.
