What's New: 2 Great Bollinger Band Trading Strategies
By Colin Twiggs
March 28, 2017 3:00 a.m. EST (6:00 p.m. AEDT)
I recently updated our Bollinger Bands page to highlight two great trading strategies for Bollinger Bands:
First, if you are not familiar with Bollinger Bands here is a quick summary of basic Bollinger Band trading signals.
Bollinger Band Squeezes
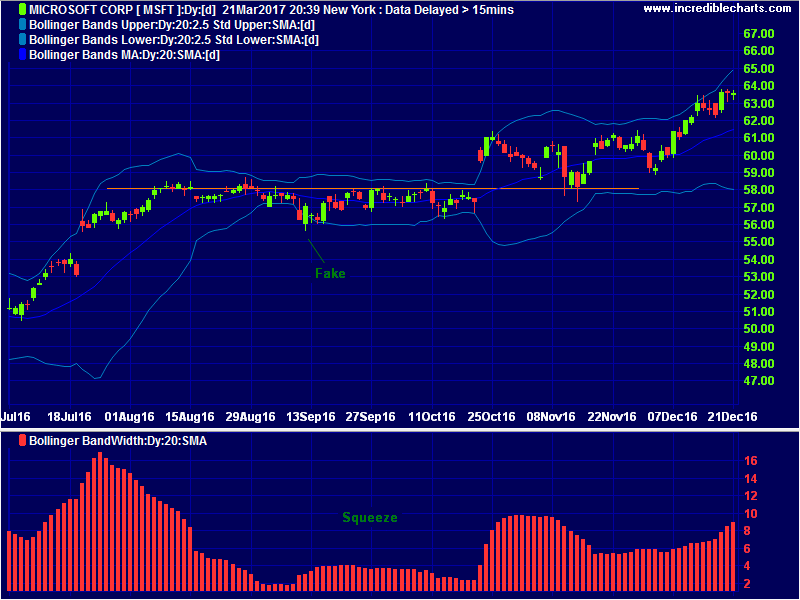
When bands contract in a narrow neck, the squeeze is highlighted by a sharp fall in Bollinger's Band Width indicator as in the Microsoft [MSFT] chart below.

The traditional way of trading the Bollinger Band squeeze is on breakout above (or below) the bands after a squeeze. Now Microsoft had been trending upward since 2012 and another advance was likely. It is important to guard against fake signals in the opposite direction, like the one highlighted in mid-September 2016.

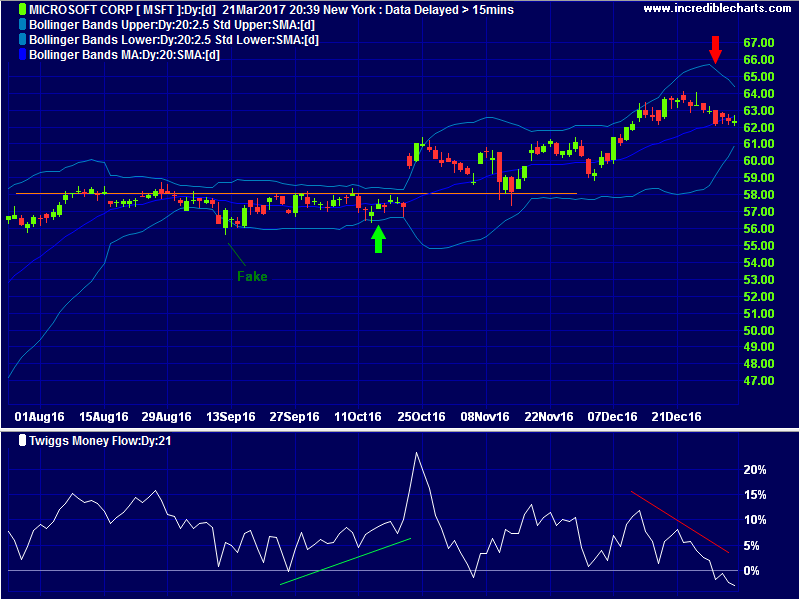
- Green arrow = Long entry
- Red arrow = Exit
- The red candle on Friday, September 9th closed below the lower band after a narrow Bollinger squeeze, signaling a downward break, before a large engulfing candle on Monday warned of reversal to an up-trend. The primary trend would alert traders to treat shorter-term bear signals with caution but it is also advisable to use Twiggs Money Flow to confirm buying or selling pressure. Here 21-day Twiggs Money Flow is oscillating above zero, indicating buying pressure despite the downward breakout. So the trade would be ignored.
- Subsequent rising troughs on Twiggs Money Flow would give me sufficient confidence to enter the trade [green arrow] before the next breakout, with a stop below the recent low at $56. More cautious traders would wait for breakout above the upper Bollinger Band but this often gives a wider risk margin because the stop should still be set below $56. The subsequent pull-back to test support in November 2016 underlines the need not to set stops at the breakout level.
- Exit [red arrow] on bearish divergence on Twiggs Money Flow, when the second dip crosses below zero, or if price closes below the lower Bollinger Band.
Bollinger Band Trends
The second strategy is a trend-following strategy I picked up from Nick Radge's book Unholy Grails, where he uses 100-day Bollinger Bands to capture trend momentum. The rules are simple:
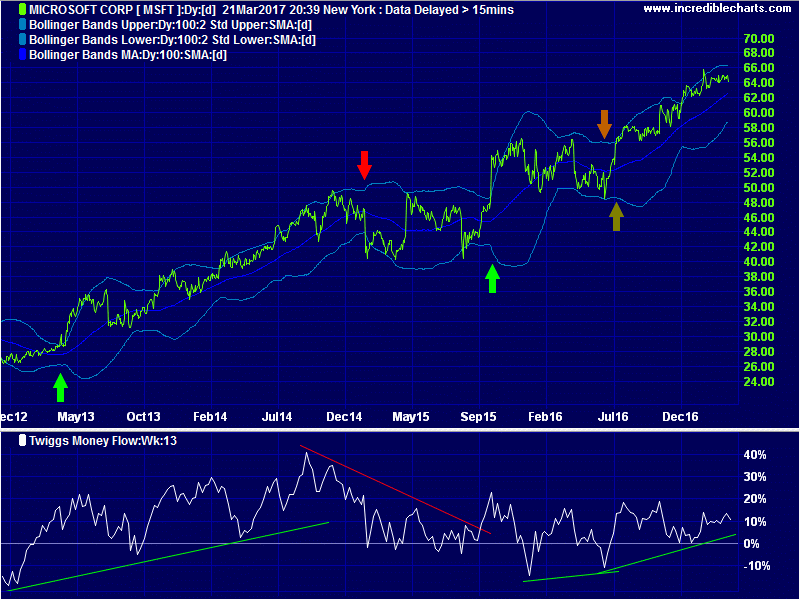
- Enter when price closes above the upper Bollinger Band
- Exit when price closes below the lower Bollinger Band
Nick proposes setting the upper band at 3 standard deviations and the lower band at 1 standard deviation but I am wary of this (too much like curve-fitting) and would stick to bands at 2 standard deviations.
Here I have plotted Microsoft with 100-day Bollinger Bands at 2 standard deviations and 13-week Twiggs Money Flow to highlight long-term buying and selling pressure.

For a detailed discussion of trading signals, go to Bollinger Band Trends.
The shorter way to do many things is to do only one thing at a time.
~ Mozart

Author: Colin Twiggs is a former investment banker with almost 40 years of experience in financial markets. He co-founded Incredible Charts and writes the popular Trading Diary and Patient Investor newsletters.
Using a top-down approach, Colin identifies key macro trends in the global economy before evaluating selected opportunities using a combination of fundamental and technical analysis.
Focusing on interest rates and financial market liquidity as primary drivers of the economic cycle, he warned of the 2008/2009 and 2020 bear markets well ahead of actual events.
He founded PVT Capital (AFSL No. 546090) in May 2023, which offers investment strategy and advice to wholesale clients.
