S&P500 Price-Earnings suggest time to buy
By Colin Twiggs
February 03, 2017 10:00 p.m. ET (2:00 p.m. AEDT)
Disclaimer
I am not a licensed investment adviser. Please read the Disclaimer.
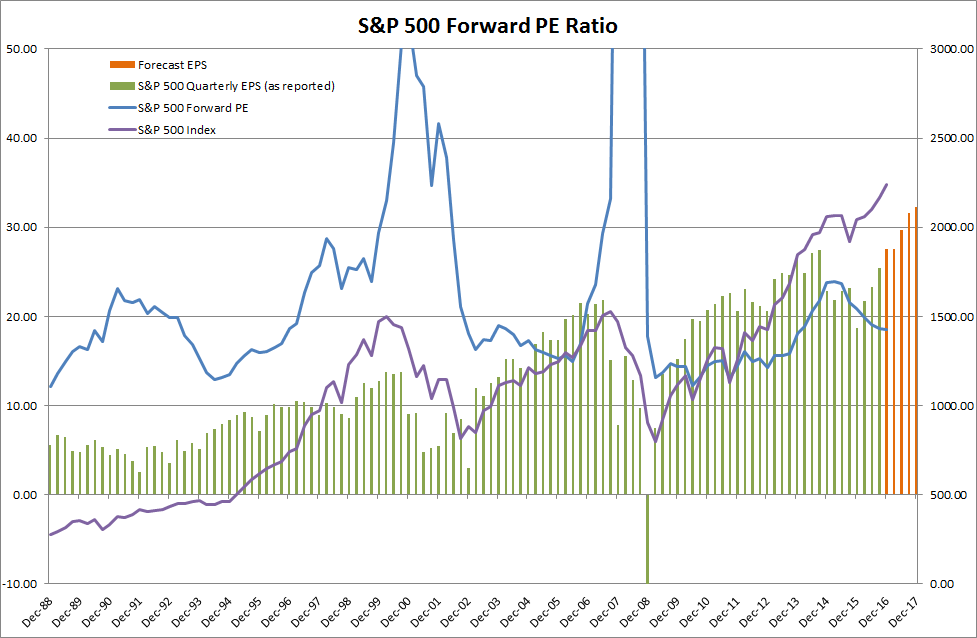
The forward Price-Earnings (PE) Ratio for the S&P 500, depicted by the blue line on the chart below, recently dipped below 20. In 2014 to 2105, PEs above 20 warned that stocks were overpriced.
We can see from the green and orange bars on the chart that the primary reason for the dip in forward PE is more optimistic earnings forecasts for 2017.

We can also see, from an examination of the past history, that each time forward PE dipped below 20 it was an opportune time to buy.
History also shows that each time the forward PE crossed to above 20 it was an opportune time to stop buying. Not necessarily a sell signal but a warning to investors to tighten their stops.
Sector Performance
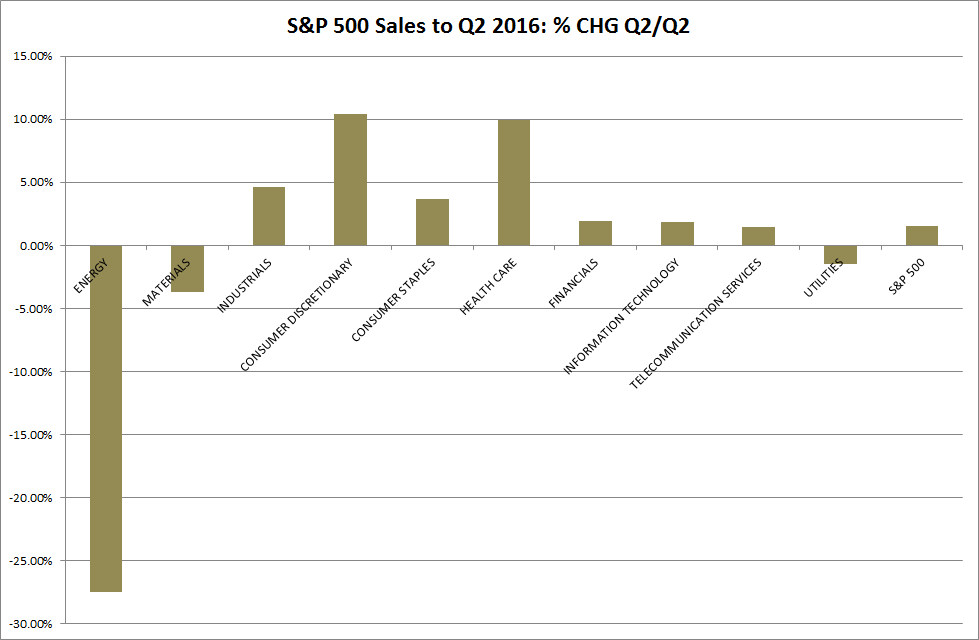
Quarterly sales figures are only available to June 2016 but there are two stand-out sectors that achieved quarterly year-on-year sales growth in excess of 10 percent: Consumer Discretionary and Health Care.

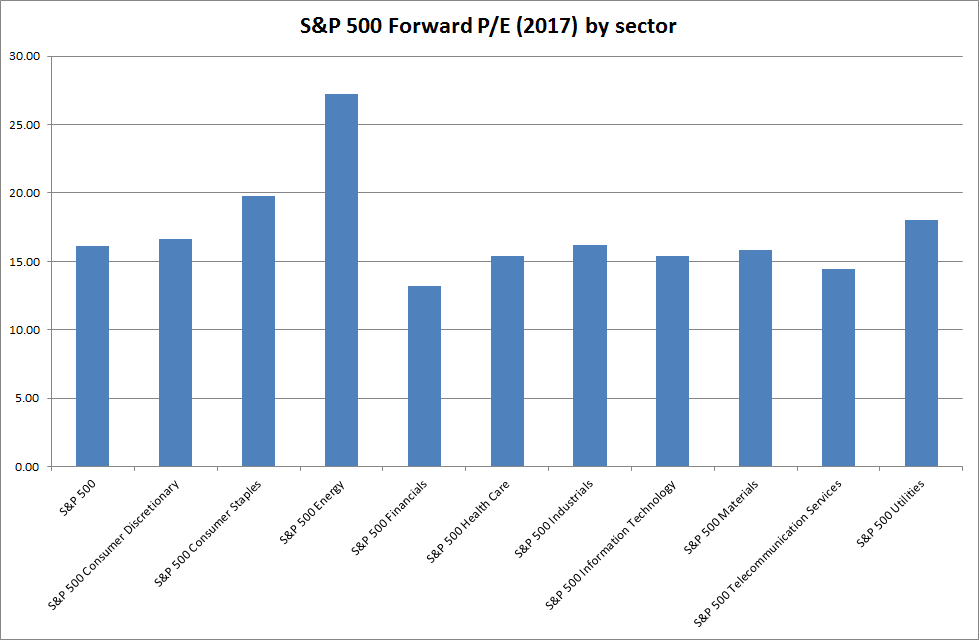
Interestingly, apart from Energy where there has been a sharp drop in earnings, sectors with the highest forward PE (based on estimated operating earnings) are the defensive sectors: Consumer Staples and Utilities. While Consumer Discretionary and Health Care are more middle-of-the-pack at 16.7 and 15.4 respectively.

Whenever you find that you are on the side of the majority, it is time to reform.
~ Samuel Clemens

Author: Colin Twiggs is a former investment banker with almost 40 years of experience in financial markets. He co-founded Incredible Charts and writes the popular Trading Diary and Patient Investor newsletters.
Using a top-down approach, Colin identifies key macro trends in the global economy before evaluating selected opportunities using a combination of fundamental and technical analysis.
Focusing on interest rates and financial market liquidity as primary drivers of the economic cycle, he warned of the 2008/2009 and 2020 bear markets well ahead of actual events.
He founded PVT Capital (AFSL No. 546090) in May 2023, which offers investment strategy and advice to wholesale clients.
