Fedex surge signals expected rise
By Colin Twiggs
November 19, 2016 2:00 a.m. ET (6:00 p.m. AEDT)
Disclaimer
I am not a licensed investment adviser.
Everything contained in this web site, related newsletters, training videos and training courses (collectively referred to as the "Material") has been written for the purpose of teaching analysis, trading and investment techniques. The Material neither purports to be, nor is it intended to be, advice to trade or to invest in any financial instrument, or class of financial instruments, or to use any particular methods of trading or investing.
Advice in the Material is provided for the general information of readers, viewers and course attendees (collectively referred to as "Readers") and does not have regard to any particular person's investment objectives, financial situation or needs. Accordingly, no Reader should act on the basis of any information in the Material without properly considering its applicability to their financial circumstances. If not properly qualified to do this for themselves, Readers should seek professional advice.
Investing and trading involves risk of loss. Past results are not necessarily indicative of future results.
The decision to invest or trade is for the Reader alone. I expressly disclaim all and any liability to any person, with respect of anything, and of the consequences of anything, done or omitted to be done by any such person in reliance upon the whole or any part of the Material.
United States
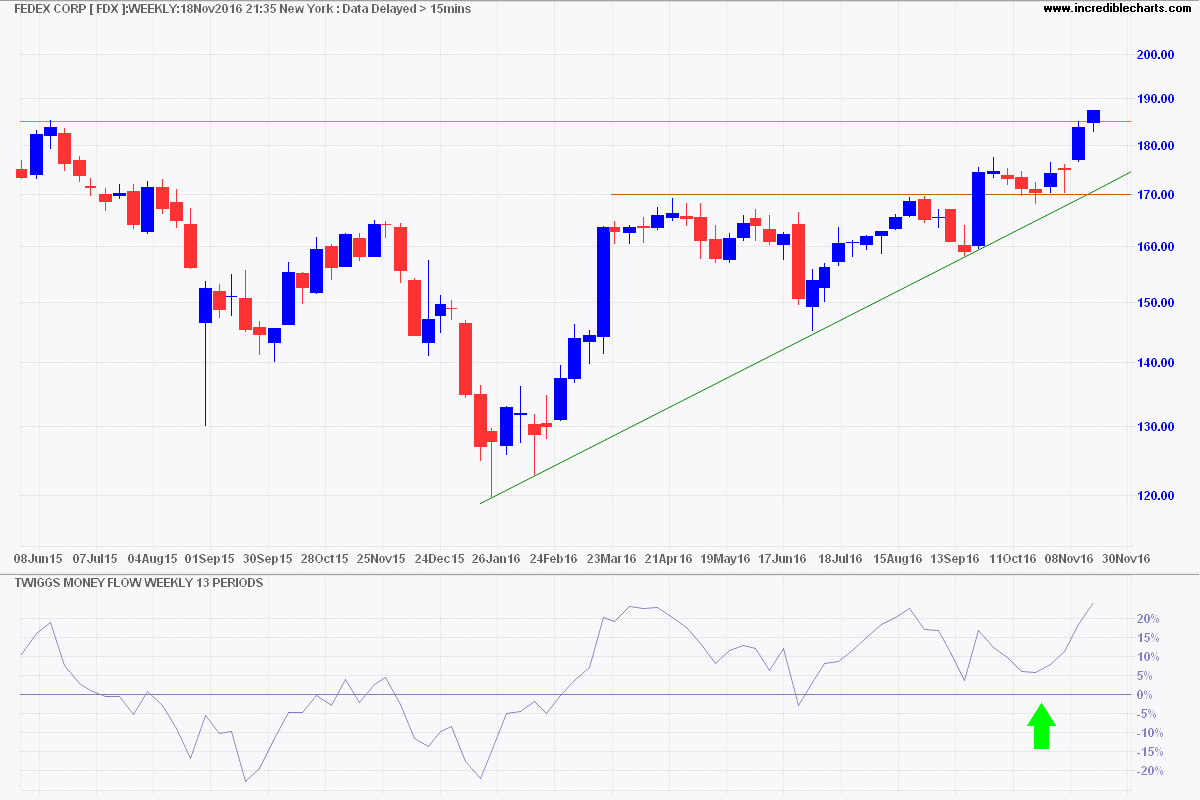
Bellwether transport stock Fedex surged to a new high this week, signaling an expected rise in economic activity in the US. A Twiggs Money Flow trough above zero also indicates strong buying pressure.
Dow Jones Industrial Average is testing resistance at 19000. The doji star indicates indecision rather than a reversal. Declining Twiggs Money Flow indicates long-term selling pressure but completion of a trough above zero would negate this. A fall below 18500 would warn of a correction. Follow-through above 19000 is less likely but would indicate a fresh advance.
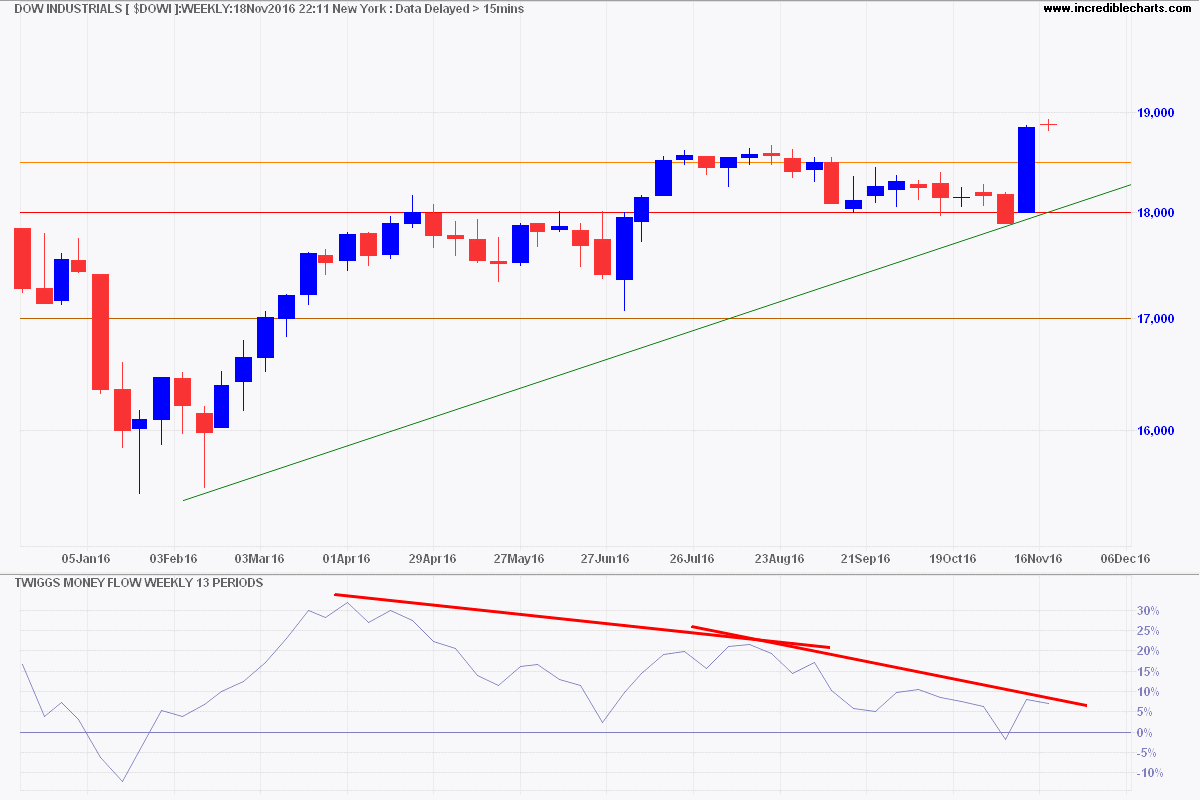
* Target medium-term: 18000 + ( 18500 - 17000 ) = 19500
The S&P 500 is testing resistance at 2200. The evening star pattern again indicates indecision rather than reversal. Breakout would complete a bullish inverted scallop pattern, which commenced in early July, signaling an advance to 2300. Declining Twiggs Money Flow remains bearish, favoring another retracement.
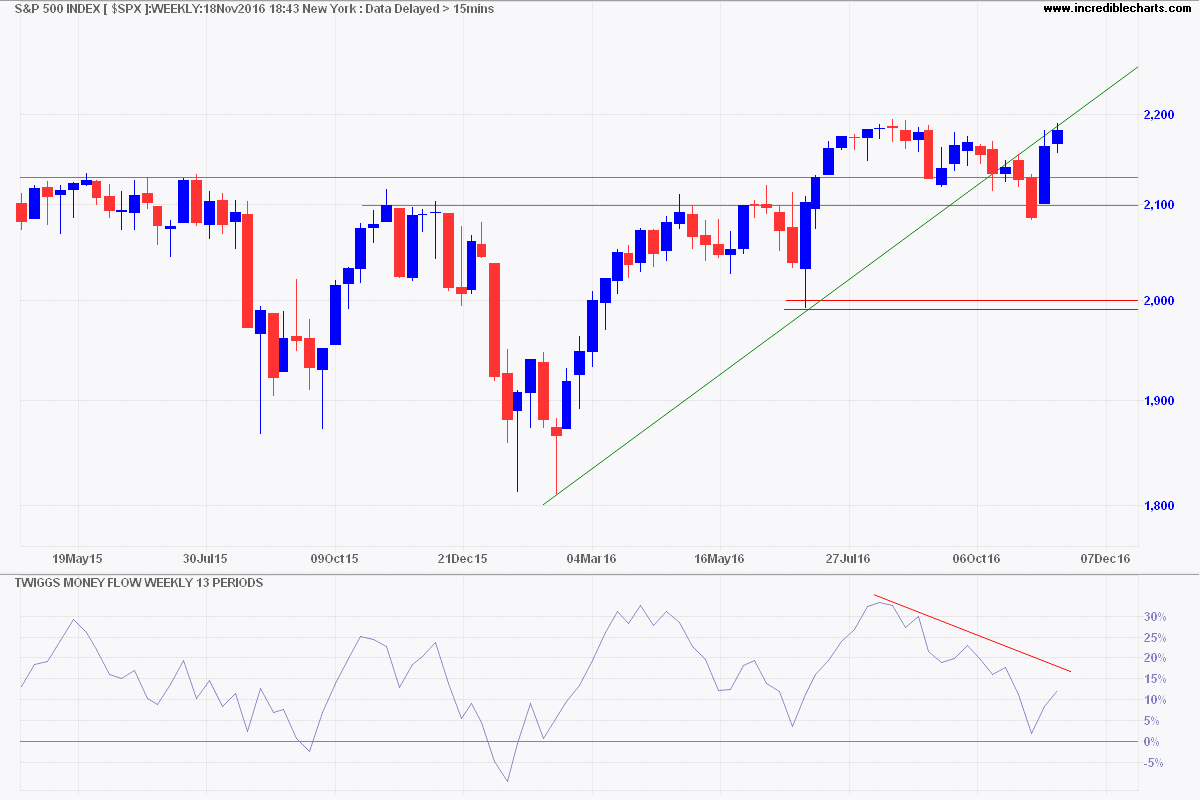
* Target medium-term: 2100 + ( 2200 - 2000 ) = 2300
Australia
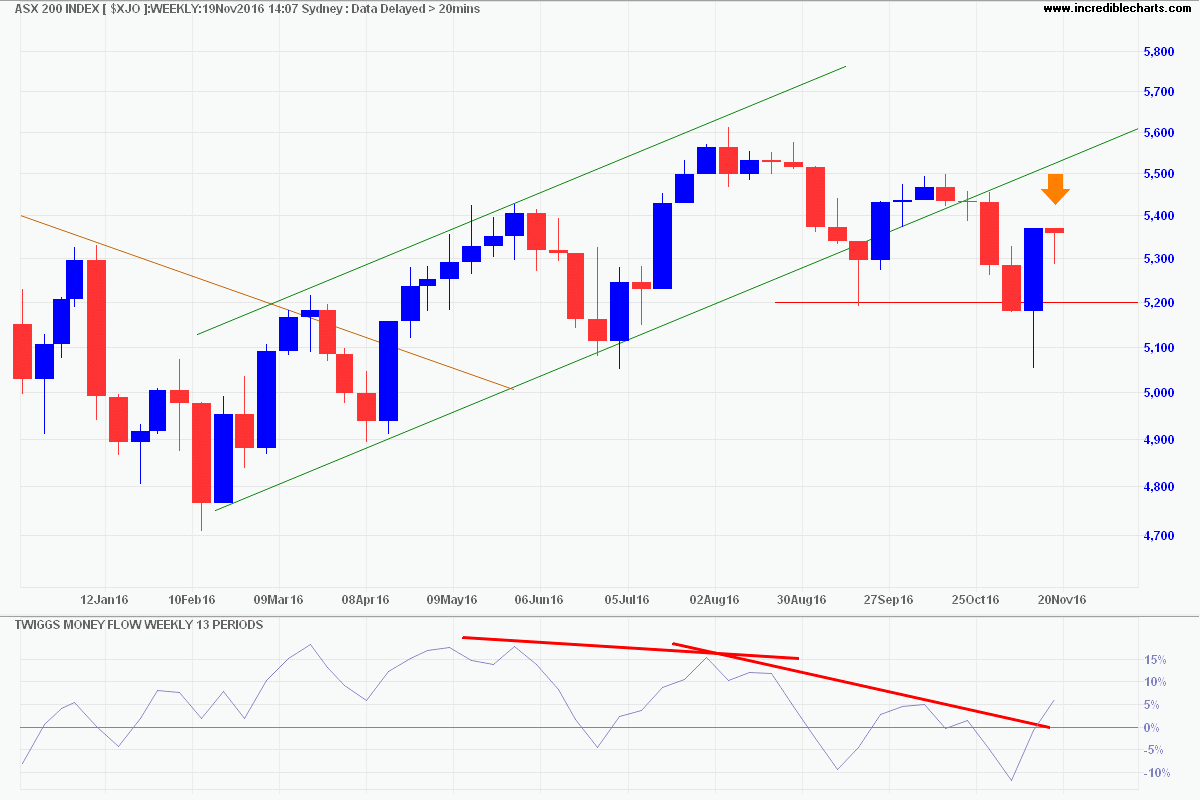
The ASX 200 is again running into resistance, signaled by a hammer after the recent rally. In terms of Dow Theory, the primary down-trend is intact but retracement that respects the former primary support level of 5200 would suggest a bear trap. Recovery above 5500 is still in doubt but would offer a bull signal.
ASX 300 Banks Index broke out above 8000 but this week's short candlestick body warns of hesitancy. Expect retracement to test the new support level. Failure of support would warn of a bull trap. Respect of support is as likely, however, and would confirm a primary up-trend with a target of 8800*. Recovery of Twiggs Money Flow above zero is still tentative at this stage.
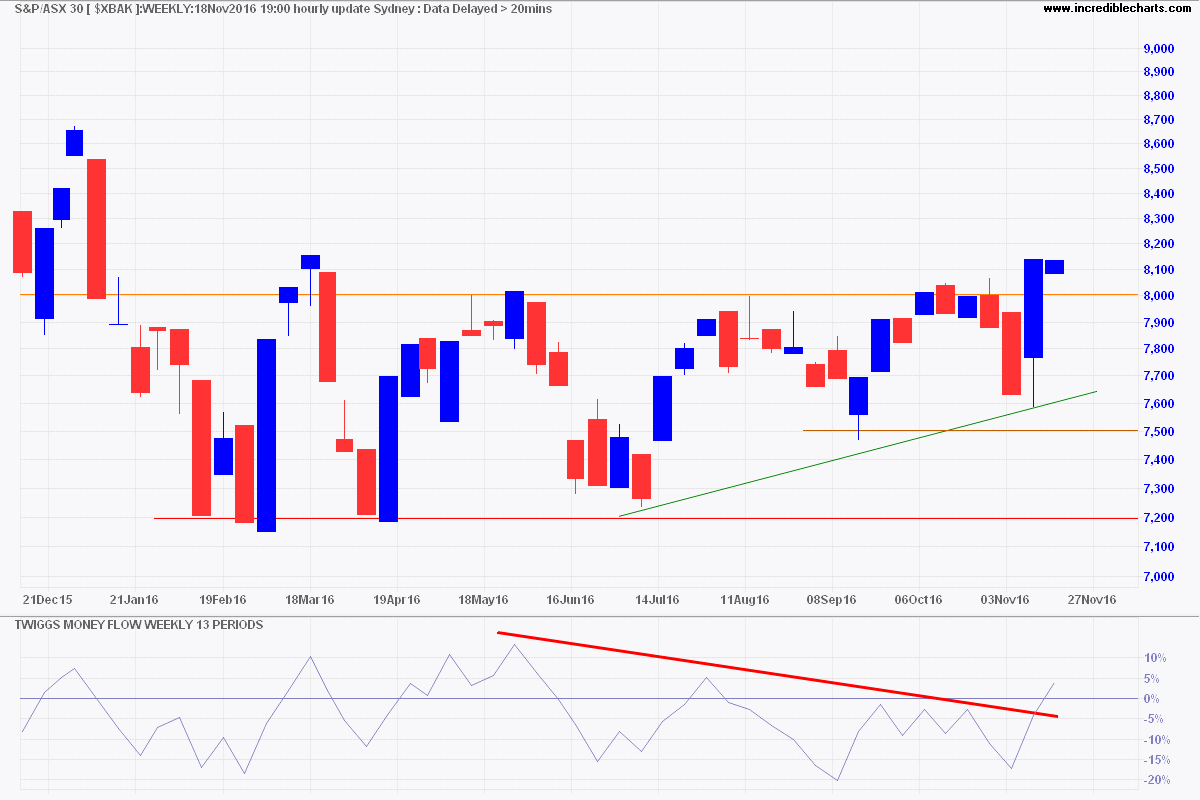
* Target medium-term: 8000 + ( 8000 - 7200 ) = 8800
In the history of mankind many republics have risen, have flourished for a less or greater time, and then have fallen because their citizens lost the power of governing themselves and thereby of governing their state; and in no way has this loss of power been so often and so clearly shown as in the tendency to turn the government into a government primarily for the benefit of one class instead of a government for the benefit of the people as a whole.
~ President Theodore Roosevelt (1903)

Author: Colin Twiggs is a former investment banker with almost 40 years of experience in financial markets. He co-founded Incredible Charts and writes the popular Trading Diary and Patient Investor newsletters.
Using a top-down approach, Colin identifies key macro trends in the global economy before evaluating selected opportunities using a combination of fundamental and technical analysis.
Focusing on interest rates and financial market liquidity as primary drivers of the economic cycle, he warned of the 2008/2009 and 2020 bear markets well ahead of actual events.
He founded PVT Capital (AFSL No. 546090) in May 2023, which offers investment strategy and advice to wholesale clients.
