Corporate valuation: Down-hill from here
By Colin Twiggs
October 08, 2016 1:00 a.m. EDT/4:00 p.m. AEST
Disclaimer
I am not a licensed investment adviser.
Everything contained in this web site, related newsletters, training videos and training courses (collectively referred to as the "Material") has been written for the purpose of teaching analysis, trading and investment techniques. The Material neither purports to be, nor is it intended to be, advice to trade or to invest in any financial instrument, or class of financial instruments, or to use any particular methods of trading or investing.
Advice in the Material is provided for the general information of readers, viewers and course attendees (collectively referred to as "Readers") and does not have regard to any particular person's investment objectives, financial situation or needs. Accordingly, no Reader should act on the basis of any information in the Material without properly considering its applicability to their financial circumstances. If not properly qualified to do this for themselves, Readers should seek professional advice.
Investing and trading involves risk of loss. Past results are not necessarily indicative of future results.
The decision to invest or trade is for the Reader alone. I expressly disclaim all and any liability to any person, with respect of anything, and of the consequences of anything, done or omitted to be done by any such person in reliance upon the whole or any part of the Material.
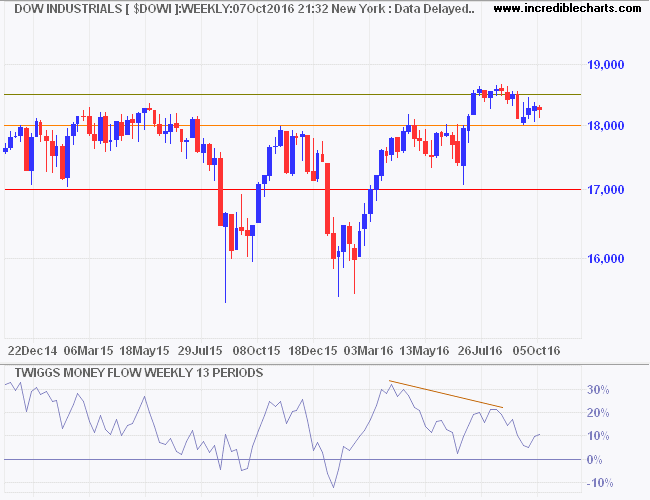
The Dow has been struggling to break clear of 18000 for the last two years. The index seems to have lost direction and is again testing support at 18000. Bearish divergence on Twiggs Money Flow warns of long-term selling pressure. Breach of 18000 would test primary support at 17000.

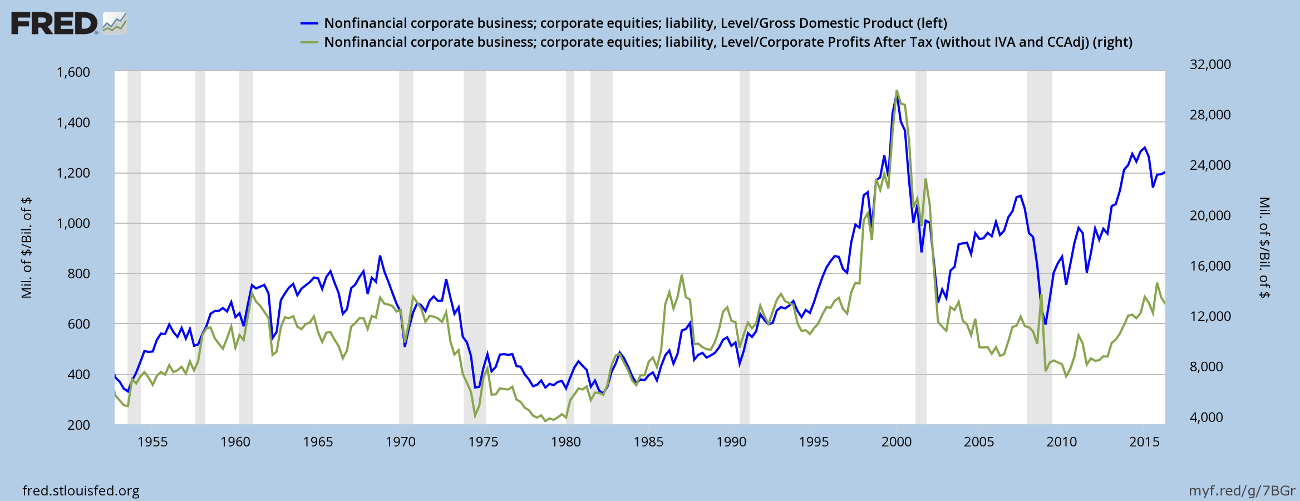
One of Warren Buffett's favorite measures of market valuation is to compare total stock market capitalization to GDP (the blue line below). High values suggests that stocks are over-priced and low values indicate the market is under-priced. Market cap to GDP should be a constant ratio. Individual stocks may outperform the broad market but it is difficult for the market as whole to grow at a faster pace than the economy.
If we use Buffett's indicator, stocks are way over-priced and investors should reduce their exposure. But is that view correct? The second (green) line compares stock market capitalization to corporate earnings. A major divergence occurred after the Dotcom crash, with corporate earnings growing at a faster rate than GDP, and much lower valuations compared to corporate earnings.

Click graph to view full-size image.
If we ignore valuations during the Dotcom bubble, however, stock market capitalization to corporate earnings is still at the top of its "normal" valuation range — matching peaks in the 1960s, 70s and early 90s.
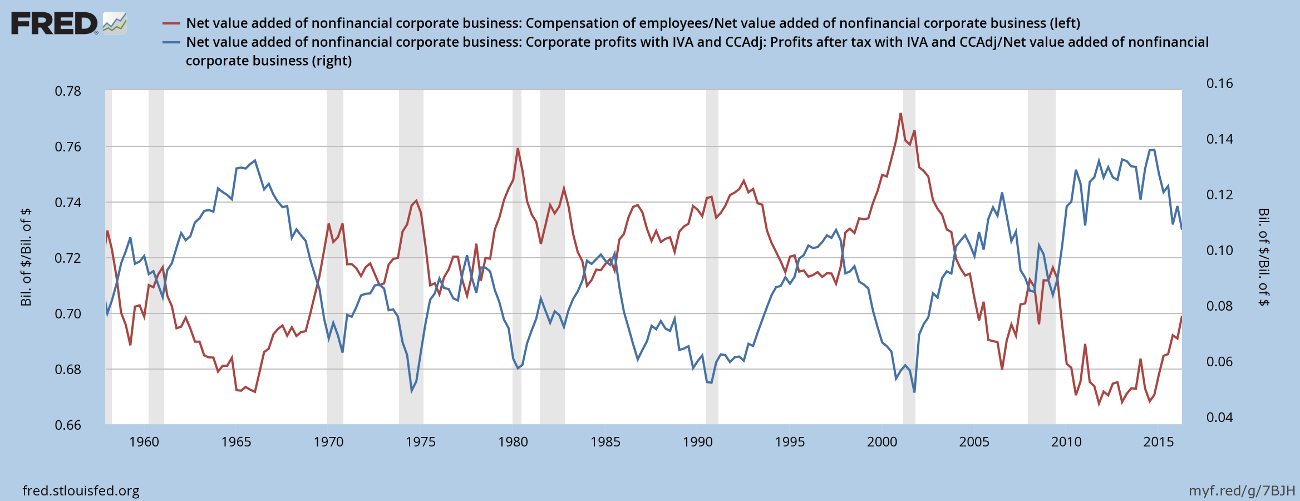
Let's also not dismiss Buffett's measure so readily. Corporate profits grew at a faster pace than GDP because wage growth was stagnant. The graph below shows Employee Compensation fell as a percentage of Net Value Added from a Dotcom high of 77% to a post-GFC low of 67%, while corporate earnings soared from below 6% to a high of 14%.

Click graph to view full-size image.
Since 2015, however, employee compensation has started to recover as the labor market tightens. And corporate earnings are falling (as a % of Net Value Added).
If you look back to the 1960s, the pattern is the same. Profits rise after a recession as labor costs fall. When the labor market reaches capacity, profits fall as labor costs rise. Then the Fed intervenes to tame inflation from rising labor costs, causing another recession.
Two things we can learn from this:
First, if the Fed intervened earlier to stop the labor market over-heating it may be able to avoid causing a recession. Now is too early, as the labor market is still a long way from equilibrium. But labor costs should reach 72% of Net Value Added in the next 12 to 18 months, signaling time to act.
Second, when corporate profits peak as a percentage of Net Value Added, the party is over. It signals time to become a long-term bear and reduce exposure to equities.
In the short run, the market is a voting machine
but in the long run it is a weighing machine.~ Benjamin Graham: Security Analysis (1934)

Author: Colin Twiggs is a former investment banker with almost 40 years of experience in financial markets. He co-founded Incredible Charts and writes the popular Trading Diary and Patient Investor newsletters.
Using a top-down approach, Colin identifies key macro trends in the global economy before evaluating selected opportunities using a combination of fundamental and technical analysis.
Focusing on interest rates and financial market liquidity as primary drivers of the economic cycle, he warned of the 2008/2009 and 2020 bear markets well ahead of actual events.
He founded PVT Capital (AFSL No. 546090) in May 2023, which offers investment strategy and advice to wholesale clients.
