S&P 500 Inverted Scallop
By Colin Twiggs
September 1, 2016 3:00 a.m. EDT (5:00 p.m. AEST)
Disclaimer
I am not a licensed investment adviser.
Everything contained in this web site, related newsletters, training videos and training courses (collectively referred to as the "Material") has been written for the purpose of teaching analysis, trading and investment techniques. The Material neither purports to be, nor is it intended to be, advice to trade or to invest in any financial instrument, or class of financial instruments, or to use any particular methods of trading or investing.
Advice in the Material is provided for the general information of readers, viewers and course attendees (collectively referred to as "Readers") and does not have regard to any particular person's investment objectives, financial situation or needs. Accordingly, no Reader should act on the basis of any information in the Material without properly considering its applicability to their financial circumstances. If not properly qualified to do this for themselves, Readers should seek professional advice.
Investing and trading involves risk of loss. Past results are not necessarily indicative of future results.
The decision to invest or trade is for the Reader alone. I expressly disclaim all and any liability to any person, with respect of anything, and of the consequences of anything, done or omitted to be done by any such person in reliance upon the whole or any part of the Material.
North America
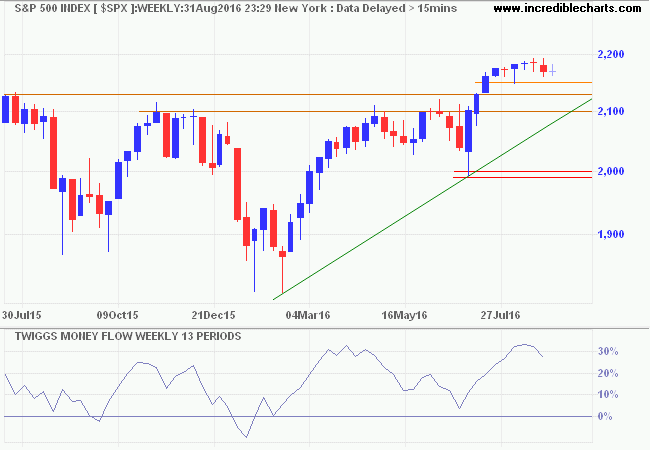
The S&P 500 is forming an inverted scallop below 2200. A rounding top requires more of a bowl shape with even sides, like an inverted "U". The inverted scallop looks more like an inverted fishing hook, with a much shorter leg on the right. A strong continuation pattern in bull markets according to Thomas Bulkowski, who ranks it 3 out of 23 (1 being best), with only a 4% break even failure rate. The pattern is completed by breakout above the high — 2200 in this case — and would only rally after testing support, around 2100 to 2130. Strong Twiggs Money Flow values suggest long-term buying pressure.

* Target calculation: 2100 + ( 2100 - 1800 ) = 2400
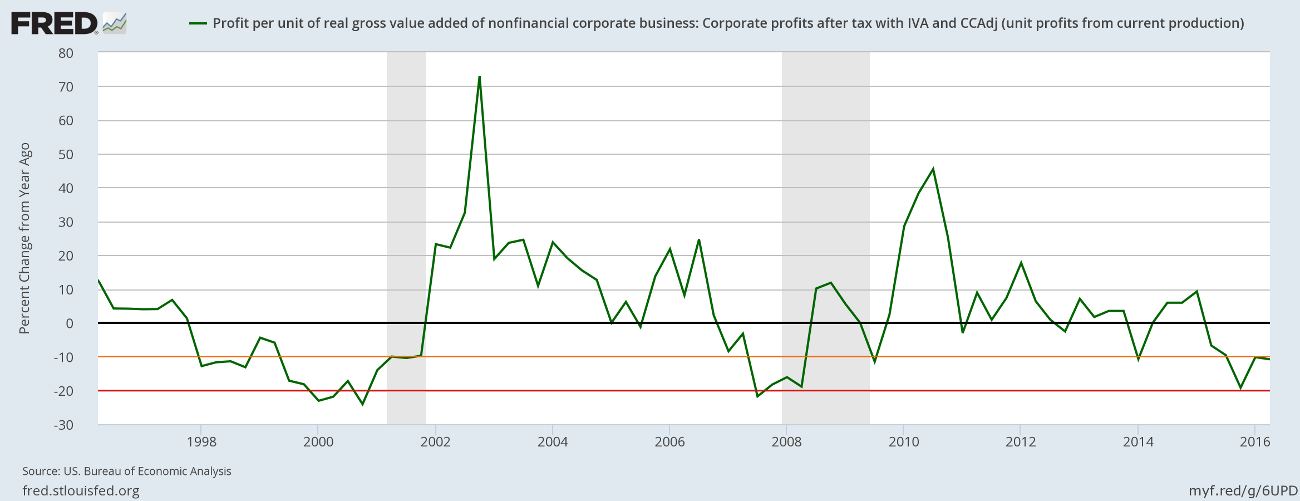
Last week's update from the Bureau of Economic Analysis, however, shows profit margins remain under pressure. Profit per unit of gross value added shrank by more than 10 percent (year-on-year) in the 2nd Quarter. Falling profit margins normally precede a recession. The difference this time is record low interest rates. Further decline in the 3rd quarter, however, would be cause for concern.

Australia
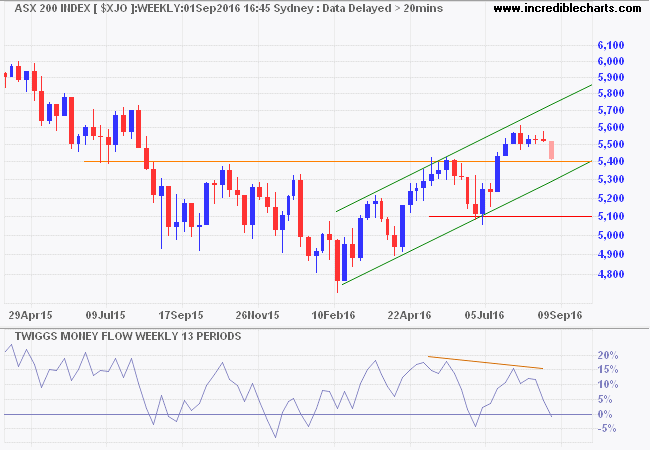
The ASX 200 broke support at 5500 and is likely to test the lower trend channel. Bearish divergence on Twiggs Money Flow warns of strong selling pressure. Breach of the lower trend channel would test primary support at 5100.

* Target calculation: 5400 + ( 5400 - 5100 ) = 5700
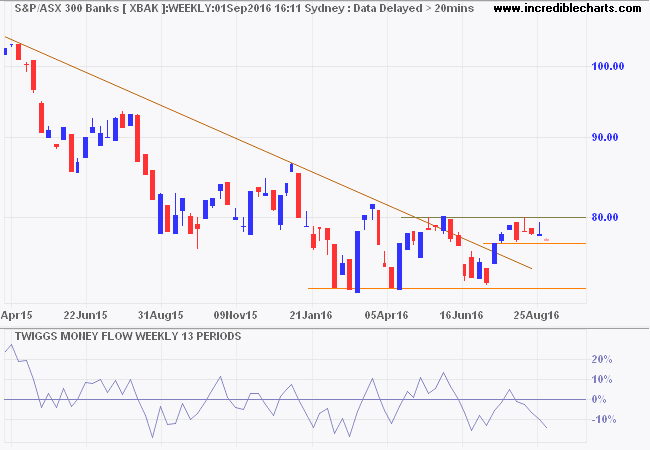
Australian banks are again retreating. Breach of support at 7700 would test primary support at 7200. Declining Money Flow peaks warn of strong selling pressure.

Men must be decided on what they will NOT do, and then they are able to act with vigor in what they ought to do.
~ Mencius, Confucian philosopher (c. 372 - 289 BC)

Author: Colin Twiggs is a former investment banker with almost 40 years of experience in financial markets. He co-founded Incredible Charts and writes the popular Trading Diary and Patient Investor newsletters.
Using a top-down approach, Colin identifies key macro trends in the global economy before evaluating selected opportunities using a combination of fundamental and technical analysis.
Focusing on interest rates and financial market liquidity as primary drivers of the economic cycle, he warned of the 2008/2009 and 2020 bear markets well ahead of actual events.
He founded PVT Capital (AFSL No. 546090) in May 2023, which offers investment strategy and advice to wholesale clients.
