Low volatility and indecision
By Colin Twiggs
August 26, 2016 11:30 p.m. EDT (1:30 p.m. AEST)
Disclaimer
I am not a licensed investment adviser.
Everything contained in this web site, related newsletters, training videos and training courses (collectively referred to as the "Material") has been written for the purpose of teaching analysis, trading and investment techniques. The Material neither purports to be, nor is it intended to be, advice to trade or to invest in any financial instrument, or class of financial instruments, or to use any particular methods of trading or investing.
Advice in the Material is provided for the general information of readers, viewers and course attendees (collectively referred to as "Readers") and does not have regard to any particular person's investment objectives, financial situation or needs. Accordingly, no Reader should act on the basis of any information in the Material without properly considering its applicability to their financial circumstances. If not properly qualified to do this for themselves, Readers should seek professional advice.
Investing and trading involves risk of loss. Past results are not necessarily indicative of future results.
The decision to invest or trade is for the Reader alone. I expressly disclaim all and any liability to any person, with respect of anything, and of the consequences of anything, done or omitted to be done by any such person in reliance upon the whole or any part of the Material.
Global
Dow Jones Global Index is again retracing to test the new support level at 316. The index is in a primary up-trend, with Momentum troughs above zero flagging trend strength.
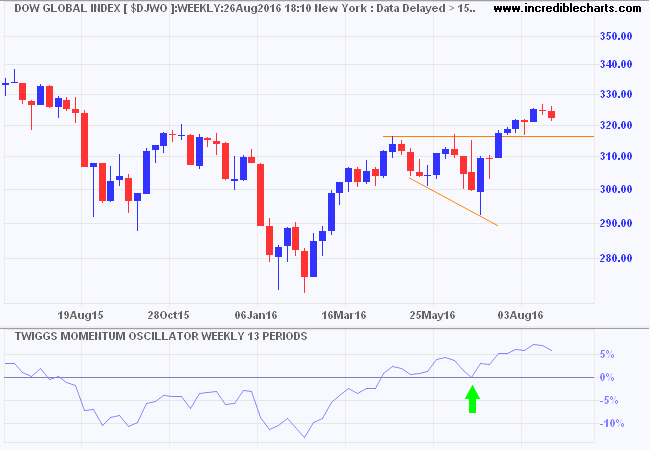
* Target calculation: 316 + ( 316 - 292 ) = 340
North America
Bob Doll from Nuveen sums up the current market well:
It will be difficult, however, for equity prices to advance without additional support. Equity indices have again hit new records, but we believe fundamental changes may be necessary for prices to continue advancing strongly. Specifically, earnings would have to improve further and/or investor flows would have to turn notably toward stocks. Neither is out of the question, but aren't likely.
The S&P 500 consolidating in a narrow range signals indecision. There is little enthusiasm but no sign of selling pressure. Narrow rectangles normally resolve in the direction of the prevailing trend but retreat below 2150 would warn of another test of medium-term support at 2100 to 2130.
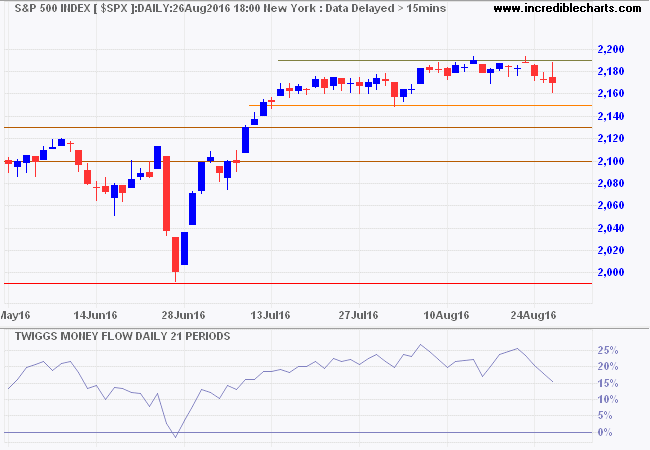
* Target calculation: 2100 + ( 2100 - 1800 ) = 2400
The Dow Jones Industrial Average is also consolidating in a narrow range. Follow-through above 18600 would normally be considered likely but bearish divergence on Twiggs Money Flow warns of selling pressure. Breach of support at 18300 would test 18000. Only breach of 18000 would warn of a test of primary support at 17000.
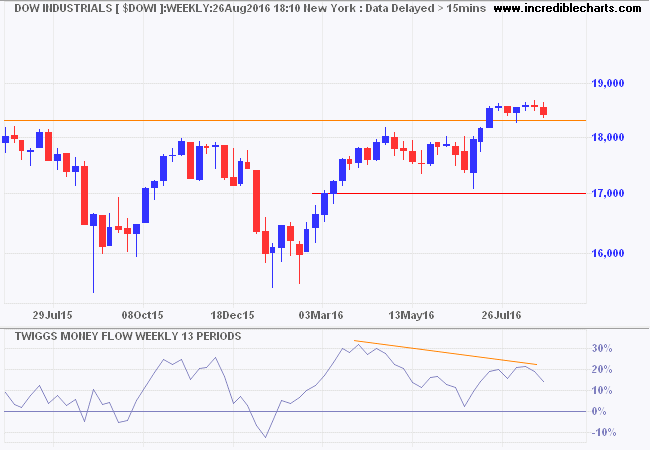
* Target medium-term: 18500 + ( 18500 - 18000 ) = 19000
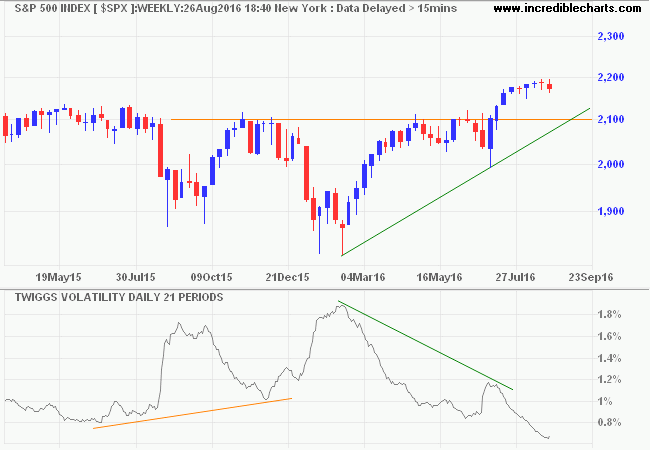
Declining Volatility suggests low risk of a sell-off. This is a new indicator that we will introduce with the next update. I find it handy for signaling market risk. Rising troughs tend to precede a market sell-off (as in early 2016), while falling peaks flag a return to business as usual. Not perfect, but a useful tool.
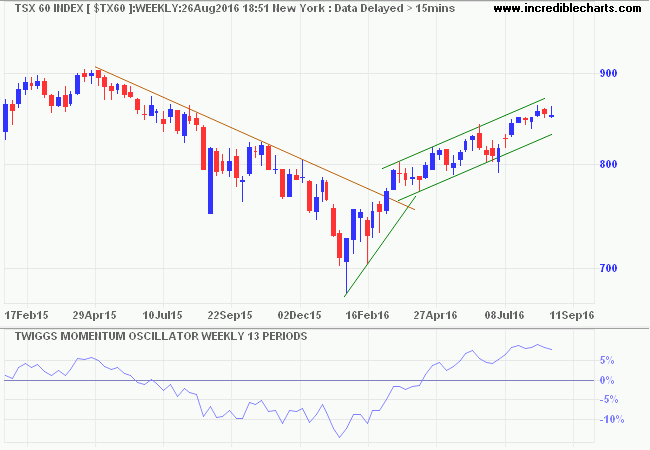
Canada's TSX 60 broke resistance at 850 and is advancing toward 900. I used linear regression to draw the latest trend channel as it seems a far better fit than the conventional method. Rising Momentum troughs above zero indicate trend strength.
Australia
The ASX 200 is consolidating in a narrow range above 5500. Bearish divergence on Twiggs Money Flow warns of selling pressure. Breach of 5500 would warn of another test of the lower trend channel.
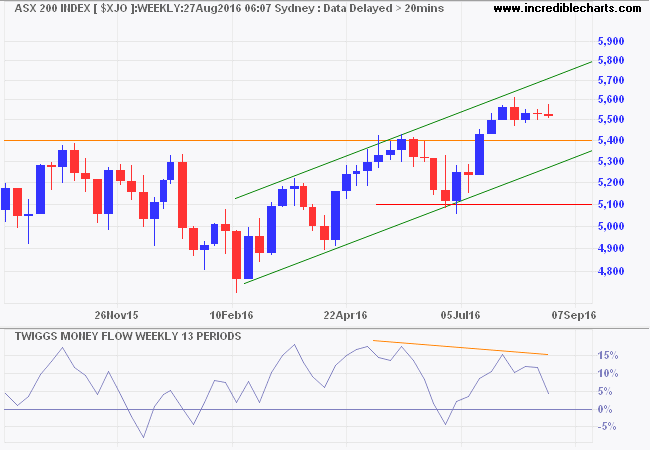
* Target calculation: 5400 + ( 5400 - 5100 ) = 5700
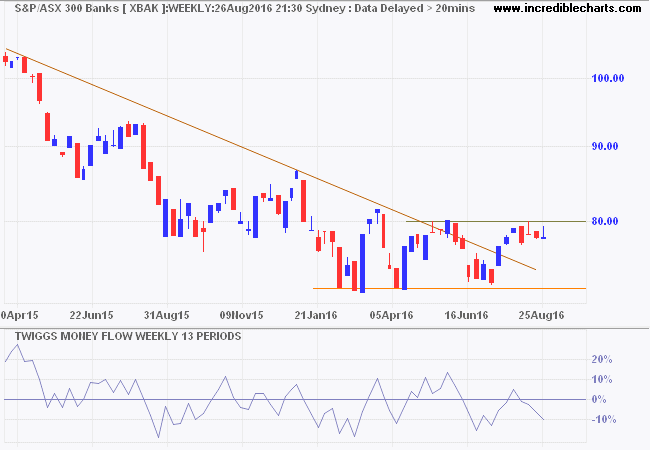
Australian banks continue to weigh on the index. The ASX 300 Banks Index is building a base between 7200 and 8000. Breakout would signal a primary up-trend, but declining Money Flow peaks warn of selling pressure. Expect another test of primary support at 7200.
If you choose not to decide, you still have made a choice.
~ Neil Peart: Freewill

Author: Colin Twiggs is a former investment banker with almost 40 years of experience in financial markets. He co-founded Incredible Charts and writes the popular Trading Diary and Patient Investor newsletters.
Using a top-down approach, Colin identifies key macro trends in the global economy before evaluating selected opportunities using a combination of fundamental and technical analysis.
Focusing on interest rates and financial market liquidity as primary drivers of the economic cycle, he warned of the 2008/2009 and 2020 bear markets well ahead of actual events.
He founded PVT Capital (AFSL No. 546090) in May 2023, which offers investment strategy and advice to wholesale clients.
