Cautious optimism
By Colin Twiggs
August 13, 2016 12:30 a.m. EDT (2:30 p.m. AEST)
Disclaimer
I am not a licensed investment adviser.
Everything contained in this web site, related newsletters, training videos and training courses (collectively referred to as the "Material") has been written for the purpose of teaching analysis, trading and investment techniques. The Material neither purports to be, nor is it intended to be, advice to trade or to invest in any financial instrument, or class of financial instruments, or to use any particular methods of trading or investing.
Advice in the Material is provided for the general information of readers, viewers and course attendees (collectively referred to as "Readers") and does not have regard to any particular person's investment objectives, financial situation or needs. Accordingly, no Reader should act on the basis of any information in the Material without properly considering its applicability to their financial circumstances. If not properly qualified to do this for themselves, Readers should seek professional advice.
Investing and trading involves risk of loss. Past results are not necessarily indicative of future results.
The decision to invest or trade is for the Reader alone. I expressly disclaim all and any liability to any person, with respect of anything, and of the consequences of anything, done or omitted to be done by any such person in reliance upon the whole or any part of the Material.
Global
Dow Jones Global Index respected support (between 316 and 320) at the top of the recent broadening formation, confirming the primary up-trend. Expect an advance to the target of 340*. Momentum troughs above zero indicate trend strength.
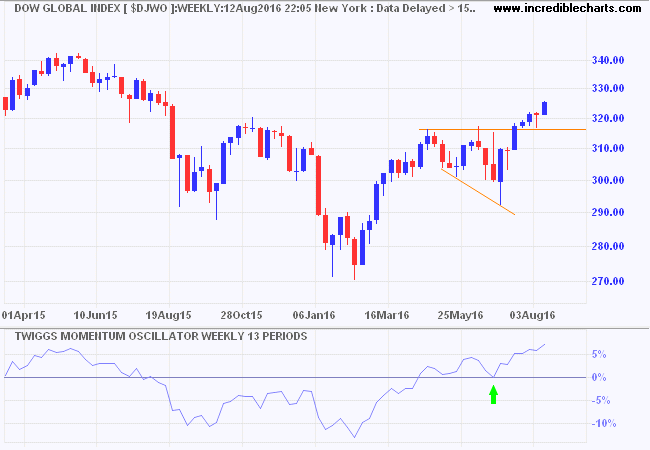
* Target calculation: 320 + ( 320 - 300 ) = 340
North America
The S&P 500 is layering in a narrow range on top of the recent rectangle. Momentum is low but there is little sign of selling pressure. This seems to reflect cautious optimism. Stocks are highly-priced at present but economic data is encouraging.
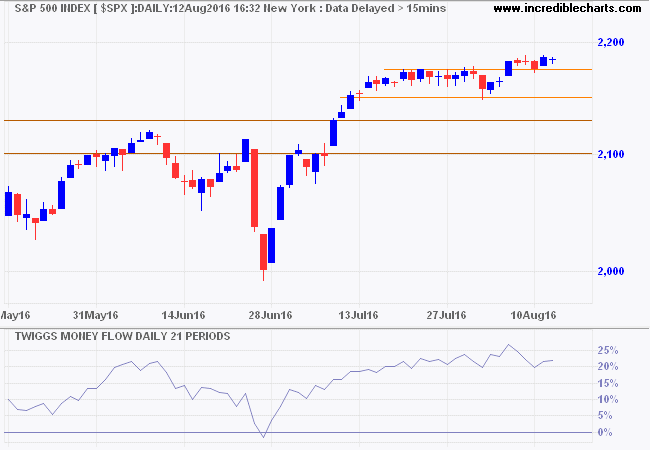
* Target calculation: 2100 + ( 2100 - 1800 ) = 2400
The Dow Jones Industrial Average respected support at 18300, confirming the primary up-trend. Target for the advance is 19000*.
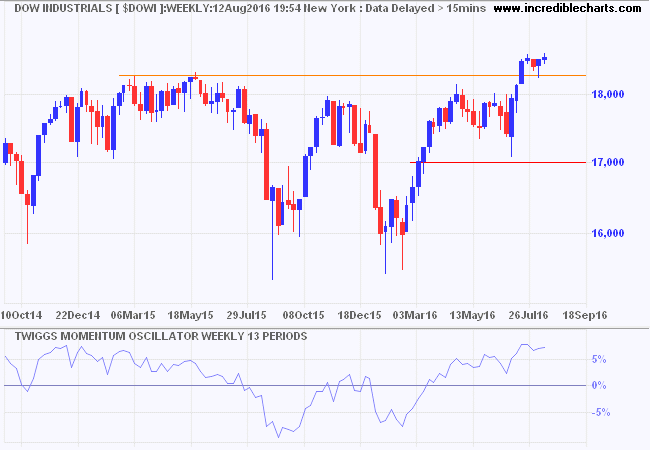
* Target medium-term: 18500 + ( 18500 - 18000 ) = 19000; Long-term: 18000 + ( 18000 - 16000 ) = 20000
The Leading Index for the United States maintains a healthy margin of more than 1 percent, suggesting no imminent threat of recession.
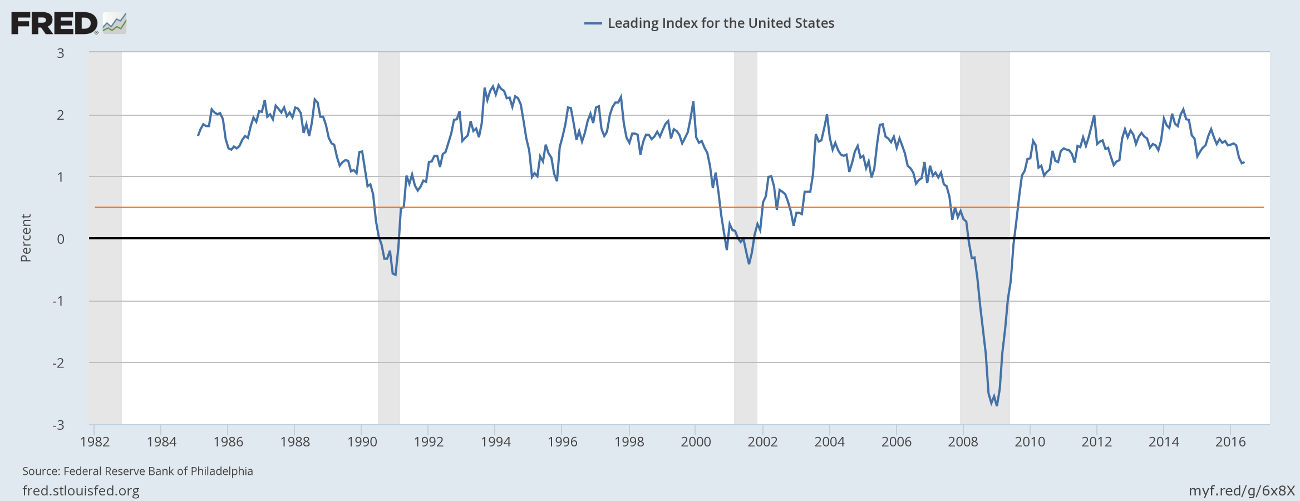
Federal Reserve Bank of Philadelphia, Leading Index for the United States [USSLIND], retrieved from FRED, Federal Reserve Bank of St. Louis.
The leading index predicts the six-month growth rate of the coincident index. In addition to the coincident index, the models include other variables that lead the economy: housing permits (1 to 4 units), initial unemployment insurance claims, delivery times from the Institute for Supply Management (ISM) manufacturing survey, and the interest rate spread between the 10-year Treasury bond and the 3-month Treasury bill.
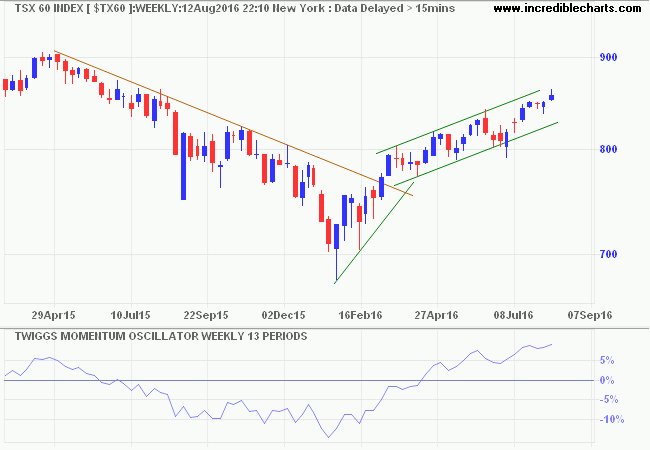
Canada's TSX 60 broke resistance at 850 and is advancing toward 900. I used linear regression to draw the latest trend channel as it seems a far better fit than the conventional method. Rising Momentum troughs above zero indicate trend strength.
Europe
Germany's DAX broke resistance at 10500, signaling a primary up-trend. Expect retracement to test the new support level. Recovery of Momentum above zero reinforces the breakout signal.
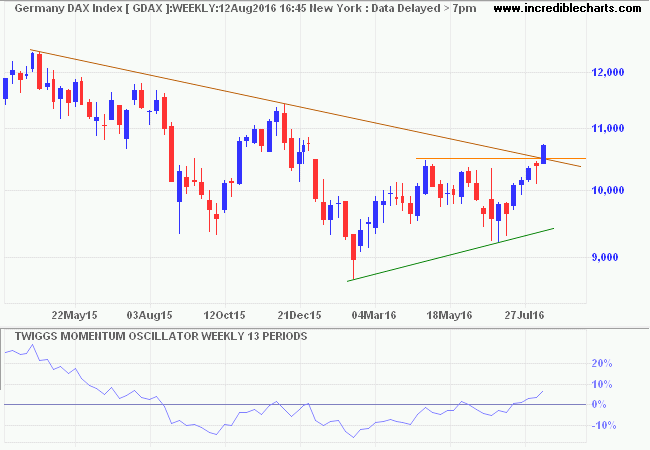
* Target calculation: 10500 + ( 10500 - 9500 ) = 11500
The Footsie is advancing toward 7000/7100*. Expect strong resistance at the all-time high. Correction towards 6500 would establish a new base for further advances.
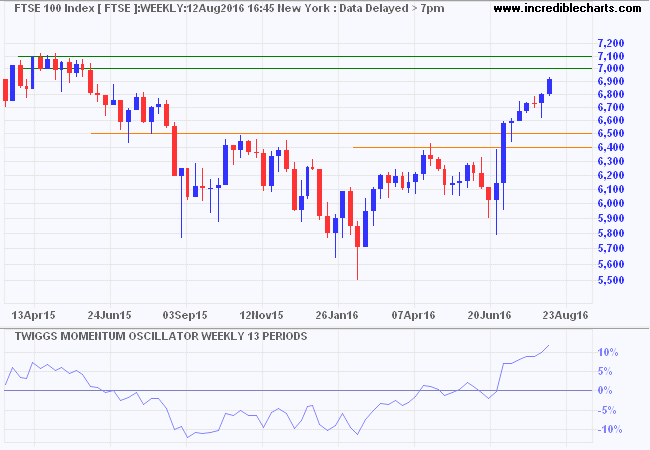
* Target calculation: 6500 + ( 6500 - 5900 ) = 7100
Asia
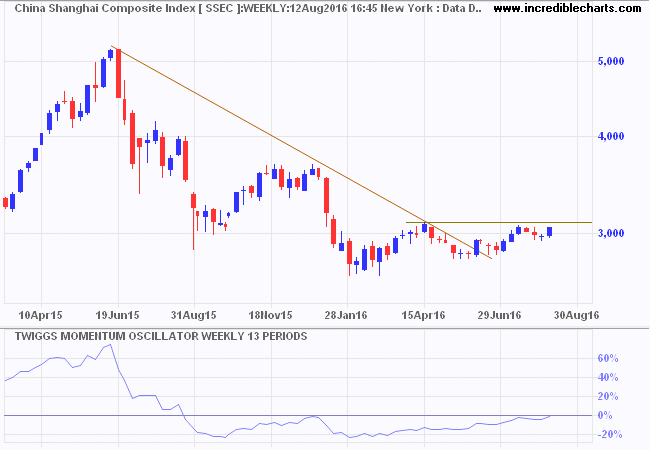
The Shanghai Composite Index rallied toward resistance at 3100. Breakout would complete a cup and handle formation, signaling further advances. But expect stubborn resistance. Recovery of Momentum above zero would be a bullish signal.
Japan's Nikkei 225 found support at 16000. Follow-through above 17500 is likely. Expect resistance at 17500. Breakout above 17500 would complete a double-bottom reversal.
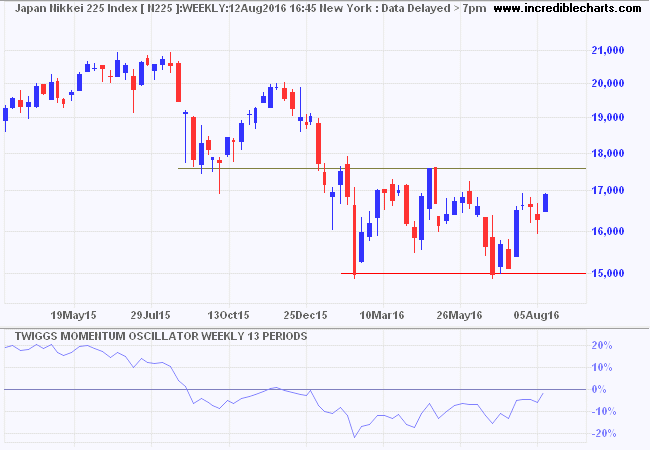
* Target calculation: 15000 - ( 18000 - 15000 ) = 12000
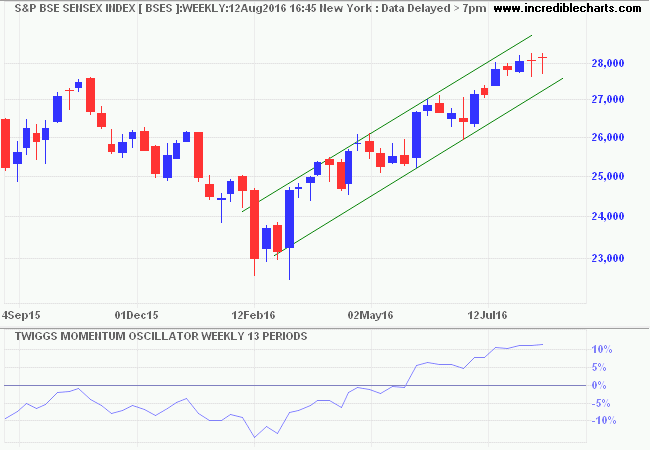
A linear regression channel captures the recent advance on India's Sensex. Breakout above resistance at 28000 looks tentative, with two consecutive dragonfly candles. Retracement to establish support at 27000 is likely. Reversal below 27000, however, would warn of a correction.
Australia
The ASX 200 is consolidating below resistance at 5600. Retreat below 5500 is likely and would test the lower trend channel at 5350/5400. The Momentum trough above zero indicates a healthy primary up-trend.
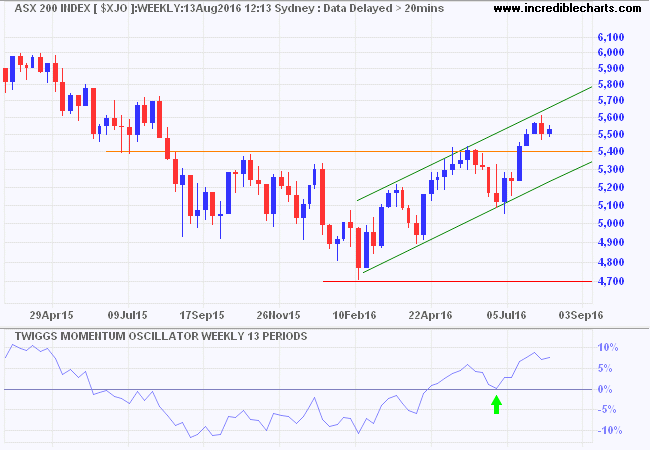
* Target calculation: 5400 + ( 5400 - 5100 ) = 5700
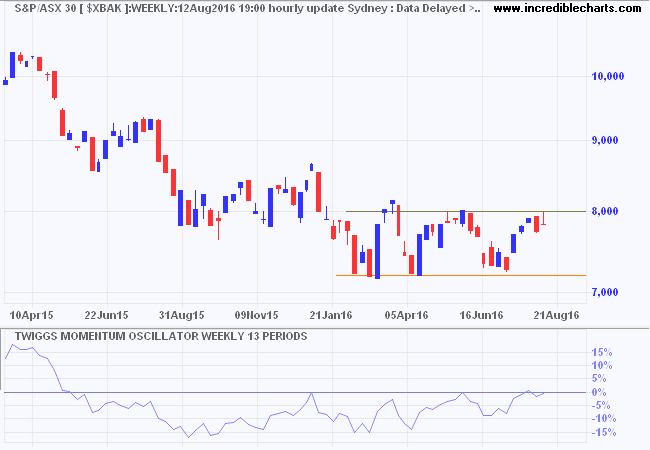
Major banks continue to weigh on the index but the ASX 300 (not "ASX 30") Banks Index is establishing a base between 7200 and 8000. Breakout would signal a primary up-trend.
A word of caution: Australian Banks are low on capital compared to their US counterparts; increased capital is likely to lower return on equity. Housing is also likely to come under pressure from an over-supply of high-density units.
My father always taught me: never worry about anyone who attacks you personally; it means their arguments carry no weight and they know it.
~ Margaret Thatcher on politics

Author: Colin Twiggs is a former investment banker with almost 40 years of experience in financial markets. He co-founded Incredible Charts and writes the popular Trading Diary and Patient Investor newsletters.
Using a top-down approach, Colin identifies key macro trends in the global economy before evaluating selected opportunities using a combination of fundamental and technical analysis.
Focusing on interest rates and financial market liquidity as primary drivers of the economic cycle, he warned of the 2008/2009 and 2020 bear markets well ahead of actual events.
He founded PVT Capital (AFSL No. 546090) in May 2023, which offers investment strategy and advice to wholesale clients.
