Pausing for breath
By Colin Twiggs
July 22, 2016 7:00 p.m. EDT (9:00 a.m. AEST)
Advice herein is provided for the general information of readers and does not have regard to any particular person's investment objectives, financial situation or needs. Accordingly, no reader should act on the basis of any information contained herein without first having consulted a suitably qualified financial advisor.
Please note
I have resigned as a director of Porter Capital Management Pty Ltd ("Porter Capital") and Porter Private Clients Pty Ltd ("Porter Private") as I find this interferes with my primary business (Incredible Charts). In future, I will no longer publish newsletters under the banner of Research & Investment nor issue investment updates for them. Alternative arrangements will be made to accommodate existing subscribers.
I do not work under an AFSL and would like to remind readers that any advice in these newsletters and on the website is provided for their general information and does not have regard to any particular person's investment objectives, financial situation or needs. Accordingly, no reader should act on the basis of any information contained herein without first having consulted a suitably qualified financial advisor.
Pausing for breath
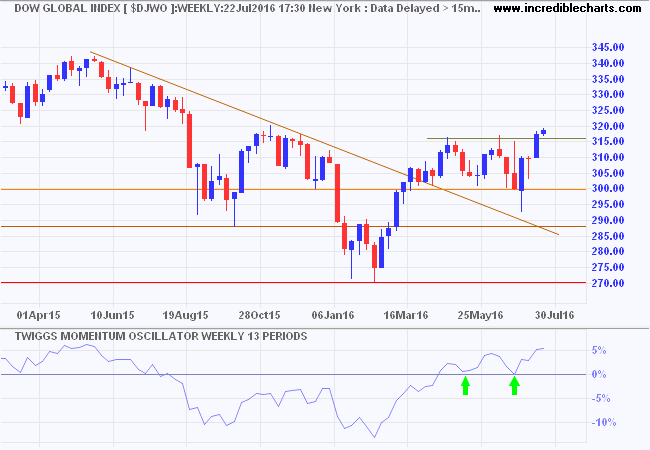
Dow Jones Global Index is pausing for breath after having broken resistance at 316. Narrow consolidation above a new support level is a bullish sign. Follow through above the October 2015 high of 320 would add further confirmation. Momentum troughs above zero also signal trend strength.
North America
The S&P 500 has similarly paused for breath, consolidating in a narrow flag over the last week. Flags are normally a continuation signal but I suspect we may see retracement to test the new support level at 2130 before the index advances much further.
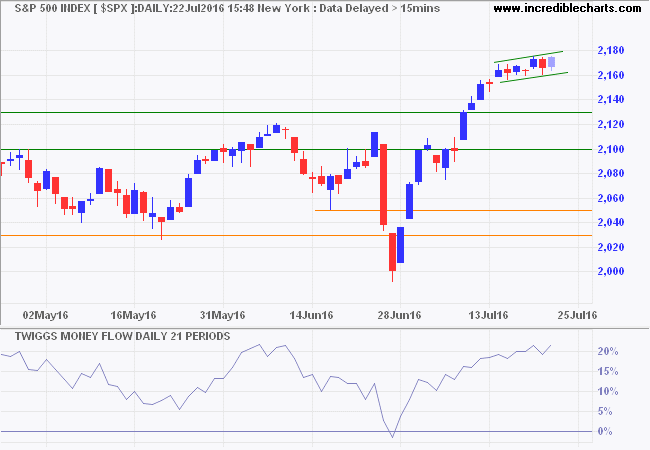
* Target calculation: 2100 + ( 2100 - 1800 ) = 2400
Rising 13-week Momentum on the Dow Jones Industrial Average weekly chart signals a primary up-trend. Retracement that respects support at 18000/18300 would confirm.
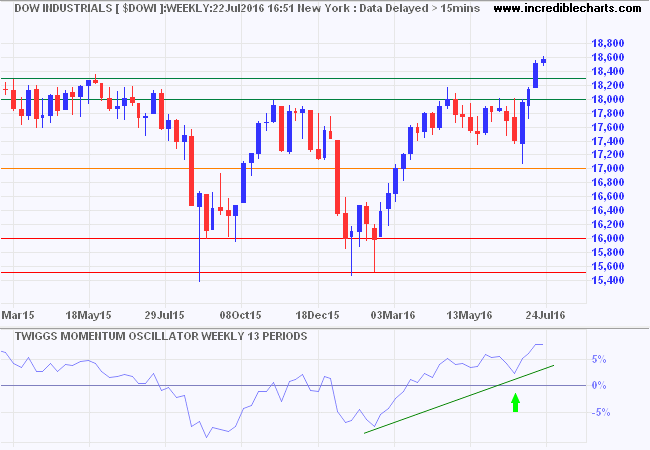
* Target calculation: 18000 + ( 18000 - 15500 ) = 20500
Europe
Germany's DAX recovered above 10000 after finding strong support, evidenced by three large tails, at 9500. Breakout above 10500 would confirm a primary up-trend.
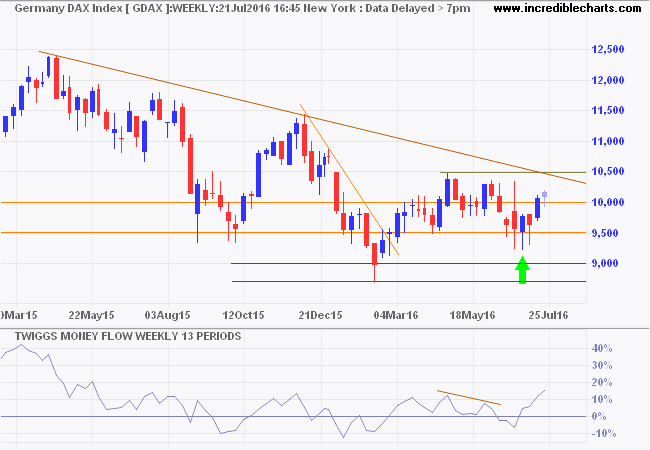
* Target calculation: 10500 + ( 10500 - 9500 ) = 11500
Boosted by the falling Pound, the Footsie has already signaled a primary up-trend. Retracement that respects 6500 would confirm.
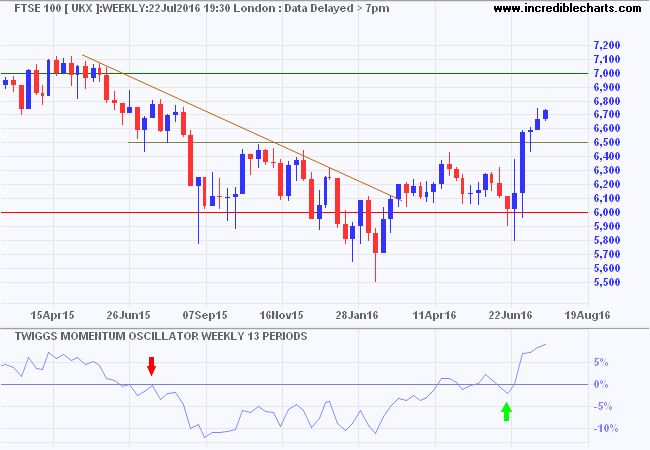
* Target calculation: 6500 + ( 6500 - 6000 ) = 7000
Australia
The ASX 200 broke through resistance at 5400, signaling a primary up-trend. Expect retracement to test the new support level. The trough above zero on 13-week Twiggs Momentum suggests a healthy up-trend.
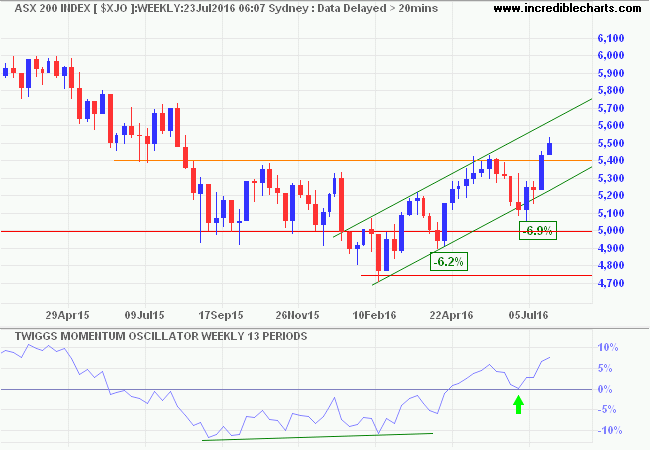
* Target calculation: 5400 + ( 5400 - 5100 ) = 5700
In Venice in the Middle Ages there was once a profession for a man called a codega—a fellow you hired to walk in front of you at night with a lit lantern, showing you the way, scaring off thieves and demons, bringing you confidence and protection through the dark streets.
~ Elizabeth Gilbert: Eat, Pray, Love

Author: Colin Twiggs is a former investment banker with almost 40 years of experience in financial markets. He co-founded Incredible Charts and writes the popular Trading Diary and Patient Investor newsletters.
Using a top-down approach, Colin identifies key macro trends in the global economy before evaluating selected opportunities using a combination of fundamental and technical analysis.
Focusing on interest rates and financial market liquidity as primary drivers of the economic cycle, he warned of the 2008/2009 and 2020 bear markets well ahead of actual events.
He founded PVT Capital (AFSL No. 546090) in May 2023, which offers investment strategy and advice to wholesale clients.
