One chart that sums up our predicament
By Colin Twiggs
July 7th, 2016 2:30 a.m. EDT/4:30 p.m. AEST
Advice herein is provided for the general information of readers and does not have regard to any particular person's investment objectives, financial situation or needs. Accordingly, no reader should act on the basis of any information contained herein without first having consulted a suitably qualified financial advisor.
Richard Russell, after conducting research in the early 1960s, based on the earlier work of Charles Dow, concluded that stock markets are over-valued when the dividend yield falls below 3.5% (and undervalued when above 6.0%). This basic rule-of-thumb held true for almost a century but times have changed and the advent of stock buybacks has significantly lowered returns to investors by way of dividend.
With dividend yields no longer an accurate reflection of returns to investors, the best measure of market value is the Price Earnings Ratio (PE). Earnings per share will fluctuate in line with dividends in the long term but, in the short-term, more accurately reflect actual performance. Companies are often reluctant to cut dividends and will instead increase the payout ratio (dividends as a percentage of earnings) rather than disappoint investors when earnings are poor. While there are a number of accounting issues related to recognition of earnings, with some inaccuracy expected when compared to actual cash flows, the relationship is likely to remain reasonably constant over time.
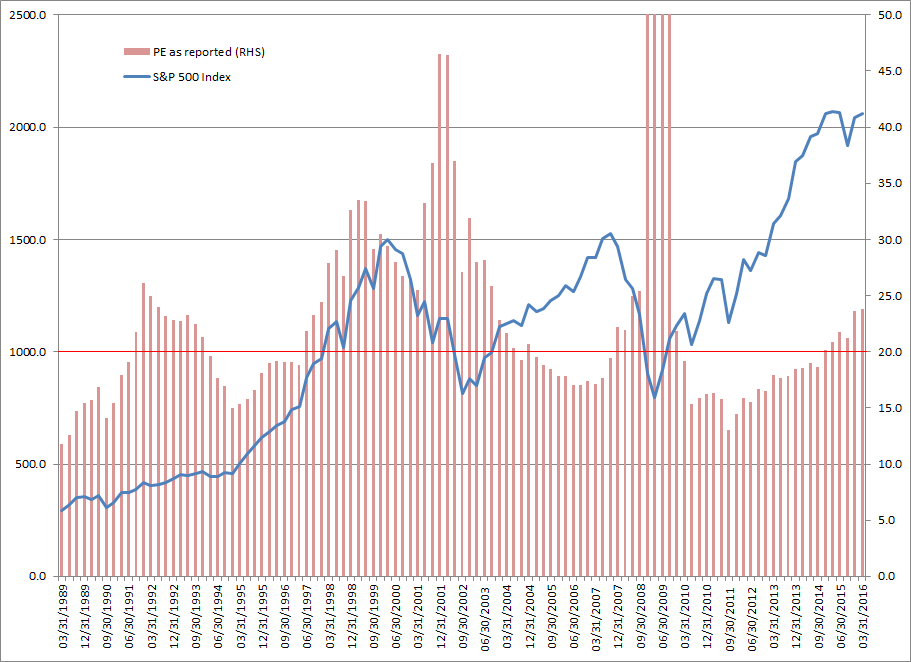
The PE ratio for an index like the S&P 500 is simply the index price divided by earnings per share weighted for all the companies that make up the index. If we chart the index PE over time, it gives a reliable measure of when stocks are highly-priced and when they are undervalued. PEs above 20 on the right-hand scale indicate when stocks are normally considered over-priced.

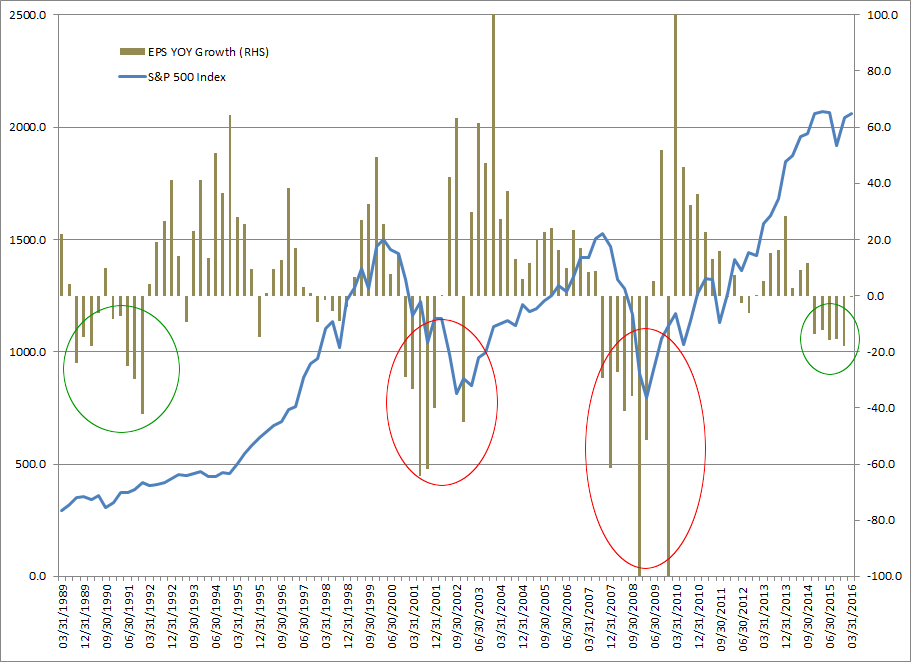
But the highest PE ratios occur, not at peaks, but after market crashes. And bull markets often coincide with lower PE ratios. Higher PEs are often attributed to animal spirits, with speculative fever driving up prices but that is often not the cause. The chart below compares the S&P 500 index to quarterly earnings per share (EPS) growth. Falling earnings, with growth below zero on the right-hand scale, that last for more than 4 quarters are highlighted with red/green depending on the severity.

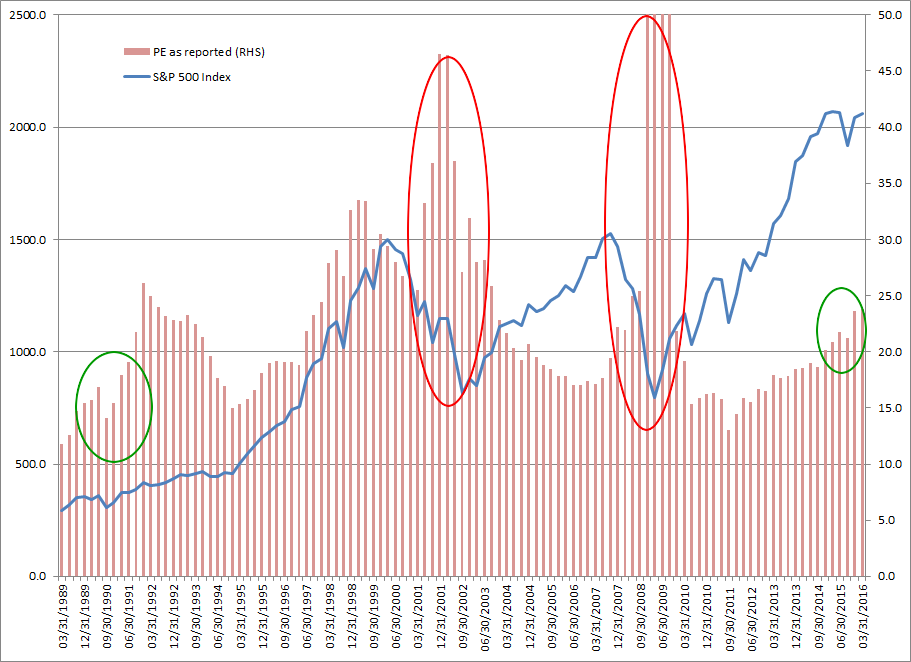
The first PE surge, in the early 1990s, was caused by declining earnings per share over more than 2 years. The market held firm, without a major collapse, because a PE ratio below 15 suggests that stocks were undervalued. Falling earnings caused the ratio to rise but it soon recovered when earnings growth resumed, leading to a record-breaking bull market.
The next major peak, in the late 1990s, was clearly a case of animal spirits. Dotcom euphoria led investors to chase prices up well ahead of earnings, with PE soaring to above 30.

I have highlighted the same periods of earnings decline (in green/red) on the chart above. The Dotcom crash, with falling earnings, caused even higher PEs as earnings declined faster than prices. EPS growth soon enough resumed as earnings recovered, out-stripping the index, with the PE ratio subsiding below 20.
Low PEs coincided with another bull market leading up to the GFC. Onset of the sub-prime crisis again caused a sharp fall in earnings, driving the PE ratio higher. The market teetered for several quarters before Lehman's collapse brought very survival of the banking system into question, with an earnings contraction so severe that a market rout was inevitable. Within a few quarters, however, the PE ratio subsided as earnings recovered.
The recent fall in earnings since 2014, brought about by falling oil and commodity prices, caused another PE surge. The ratio to As Reported Earnings rose to 23.83 at the end of March 2016. So far, the market has not panicked, similar to the response in the early 1990s.
The 1989-1991 era had its share of troubles: a savings and loan crisis in the US, Iraq invaded Kuwait, Britain was forced to withdraw the pound sterling from the European Exchange Rate Mechanism (ERM), and Japanese stock and real estate markets collapsed. The market survived these trials because valuations were modest.
Valuations are no doubt higher because of record low interest rates. But they were only driven to extremes by falling earnings. Resumption of earnings growth would be a bullish sign, with PE ratios expected to fall as growth outstrips the index. Slow growth is likely to evoke a more muted response than earlier bull markets. Unless there are further falls in earnings, however, contagion from low commodity and oil prices has been contained and we are unlikely to experience another bear market.
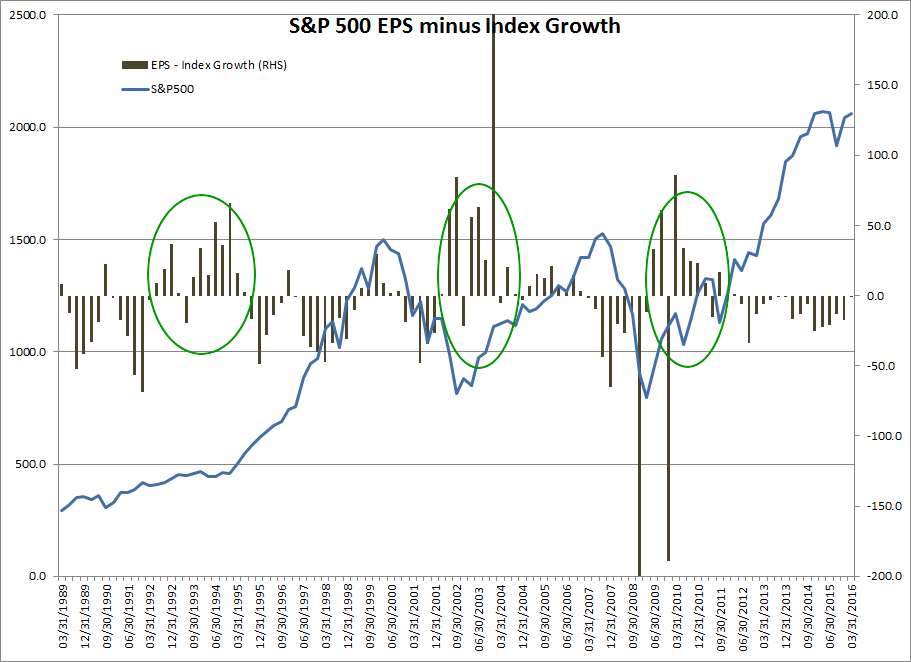
What we are waiting for is earnings to recover at a faster rate than the S&P 500 Index. I have plotted earnings (EPS) growth minus index growth on the chart below. You can see that earnings growth outstripped index growth ahead of each of the last three bull markets.

Similar signs in the next few quarters would signal the start of another advance. But it is too soon to anticipate until we see at least one good quarter of earnings growth.
Ninety eight percent of the adults in this country are decent, hardworking, honest Americans. It's the other lousy two percent that get all the publicity. But then, we elected them.
~ Lily Tomlin.
Disclaimer
Porter Private Clients Pty Ltd, trading as Research & Investment ("R&I"), is a Corporate Authorized Representative (AR Number 384 397) of Andika Pty Ltd which holds an Australian Financial Services Licence (AFSL 297069).
The information on this web site and in the newsletters is general in nature and does not consider your personal circumstances. Please contact your professional financial adviser for advice tailored to your needs.
R&I has made every effort to ensure the reliability of the views and recommendations expressed in the reports published on its websites and newsletters. Our research is based upon information known to us or which was obtained from sources which we believe to be reliable and accurate.
No guarantee as to the capital value of investments, nor future returns are made by R&I. Neither R&I nor its employees make any representation, warranty or guarantee that the information provided is complete, accurate, current or reliable.
You are under no obligation to use these services and should always compare financial services/products to find one which best meets your personal objectives, financial situation or needs.
To the extent permitted by law, R&I and its employees, agents and authorised representatives exclude all liability for any loss or damage (including indirect, special or consequential loss or damage) arising from the use of, or reliance on, any information. If the law prohibits the exclusion of such liability, such liability shall be limited, to the extent permitted by law, to the resupply of the said information or the cost of the said resupply.
Important Warning About Simulated Results
Research & Investment (R&I) specialise in developing, testing and researching investment strategies and systems. Within the R&I web site and newsletters, you will find information about investment strategies and their performance. It is important that you understand that results from R&I research are simulated and not actual results.
No representation is made that any investor will or is likely to achieve profits or losses similar to those shown.
Simulated performance results are generally prepared with the benefit of hindsight and do not involve financial risk. No modeling can completely account for the impact of financial risk in actual investment. Account size, brokerage and slippage may also diverge from simulated results. Numerous other factors related to the markets in general or to the implementation of any specific investment system cannot be fully accounted for in the preparation of simulated performance results and may adversely affect actual investment results.
To the extent permitted by law, R&I and its employees, agents and authorised representatives exclude all liability for any loss or damage (including indirect, special or consequential loss or damage) arising from the use of, or reliance on, any information offered by R&I whether or not caused by any negligent act or omission.

Author: Colin Twiggs is a former investment banker with almost 40 years of experience in financial markets. He co-founded Incredible Charts and writes the popular Trading Diary and Patient Investor newsletters.
Using a top-down approach, Colin identifies key macro trends in the global economy before evaluating selected opportunities using a combination of fundamental and technical analysis.
Focusing on interest rates and financial market liquidity as primary drivers of the economic cycle, he warned of the 2008/2009 and 2020 bear markets well ahead of actual events.
He founded PVT Capital (AFSL No. 546090) in May 2023, which offers investment strategy and advice to wholesale clients.
