Risk of a global down-turn remains high
By Colin Twiggs
February 28th, 2016 10:00 a.m. AEDT (6:00 p.m. EST)
Advice herein is provided for the general information of readers and does not have regard to any particular person's investment objectives, financial situation or needs. Accordingly, no reader should act on the basis of any information contained herein without first having consulted a suitably qualified financial advisor.
Stock markets in Asia and Europe have clearly tipped into a primary down-trend but the US remains tentative. The weight of the market is on the sell side and the risk of a global down-turn remains high.
Dow Jones Global Index found support at 270 and is rallying to test resistance at the former primary support levels of 290/300. 13-Week Twiggs Momentum peaks below zero flag a strong primary down-trend. Respect of 300 is likely and reversal below 290 warn of another decline. Breach of 270 would confirm.
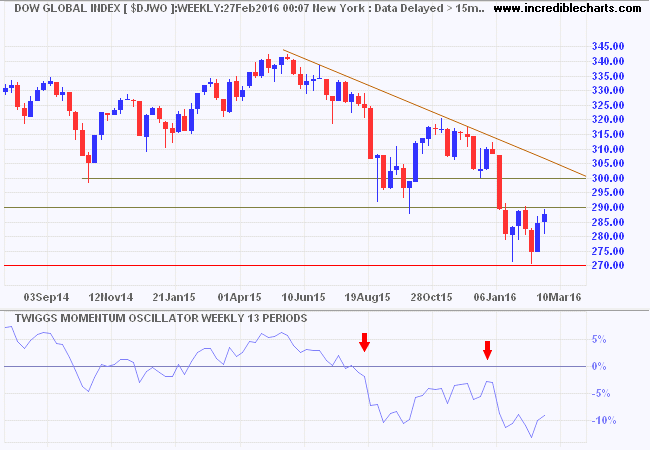
* Target calculation: 290 - ( 320 - 290 ) = 260
Willem Buiter of Citigroup warns that further monetary easing faces "strongly diminishing returns", while "hurdles for a major fiscal stimulus remain high". To me, major infrastructure spending is the only way to avoid prolonged stagnation but resistance to further increases in public debt is high. The only answer is to focus on productive infrastructure assets that generate returns above the cost of servicing debt, improving the overall debt position rather than aggravating it.
North America
Dow Jones Industrial Average recovered above primary support at 16000 and is headed for a test of 17000. Rising 13-week Twiggs Money Flow indicates medium-term buying pressure. Respect of 17000 is likely and would warn of continuation of the primary down-trend. Reversal below 16000 would confirm the signal, offering a target of 14000*.
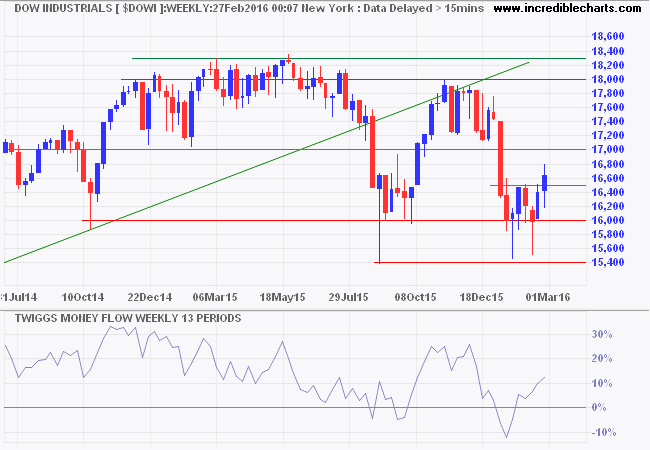
* Target calculation: 16000 - ( 18000 - 16000 ) = 14000
The most bearish sign on the Dow chart is the lower peak, at 18000, in late 2015. Only recovery above this level would indicate that long-term selling pressure has eased.
The S&P 500 is similarly testing resistance at 1950. Breakout is quite possible but only a higher peak (above 2100) would indicate that selling pressure has eased. Declining 13-week Twiggs Momentum, below zero, continues to warn of a primary down-trend. Reversal below 1870 would confirm the primary down-trend, offering a target of 1700*.
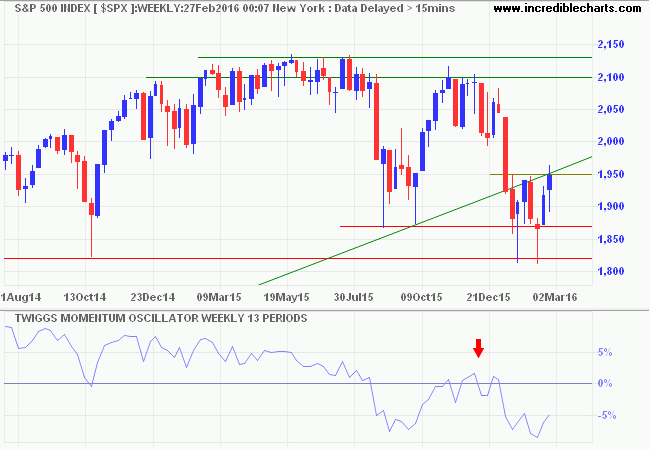
* Target calculation: 1900 - ( 2100 - 1900 ) = 1700
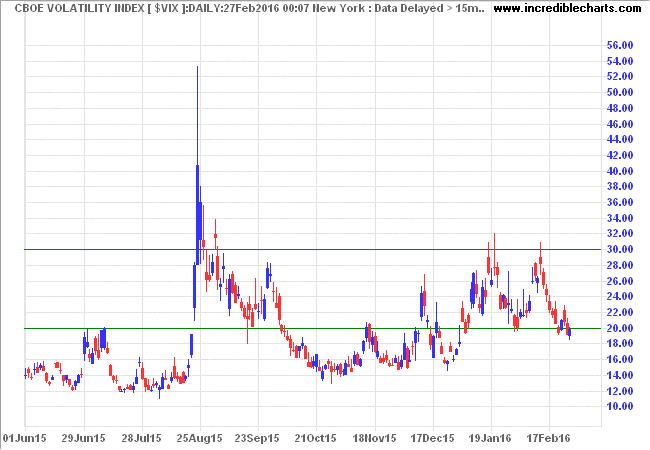
CBOE Volatility Index (VIX) is testing 'support' at 20. Respect is likely and would confirm that market risk remains elevated.
Canada's TSX 60 respected the descending trendline after breaking resistance at 750. Reversal below 750 would warn of another test of 680/700. Rising 13-week Twiggs Momentum is so far indicative of a bear rally rather than reversal of the primary down-trend.
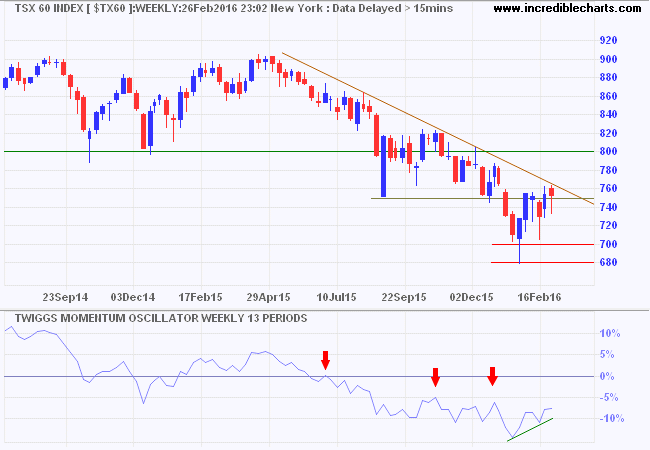
* Target calculation: 700 - ( 750 - 700 ) = 650
Europe
Dow Jones Euro Stoxx 50 is rallying to test resistance at the former primary support level of 3000. The large 13-week Twiggs Momentum peak below zero confirms a strong primary down-trend. Respect of resistance is not that important, but another lower peak, followed by reversal below 3000, would signal a decline to 2400*.
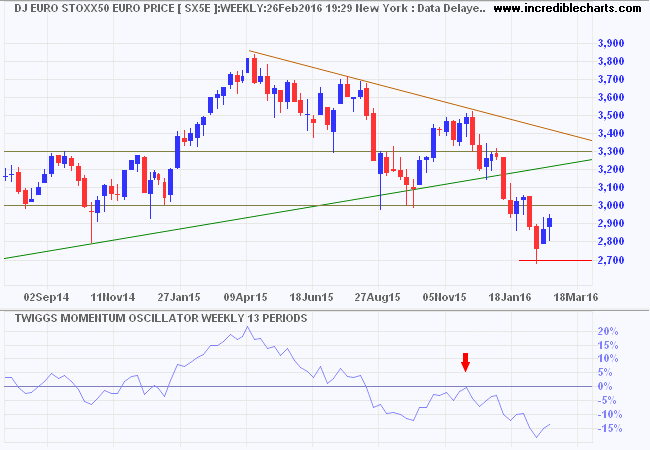
* Target calculation: 2700 - ( 3000 - 2700 ) = 2400
Germany's DAX recovered above resistance at 9300/9500. Expect a test of 10000 but buying pressure on 13-week Twiggs Money Flow appears secondary and reversal below 9300 would signal another decline, with a (long-term) target of 7500*.
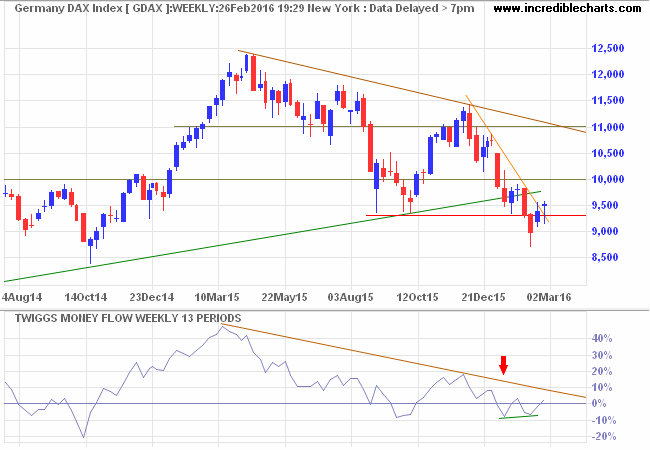
* Target calculation: 9500 - ( 11500 - 9500 ) = 7500
The Footsie recovered above 6000, and the declining trendline, but the primary trend is down. Buying pressure on 13-week Twiggs Money Flow appears secondary and reversal below 6000 would signal another decline, with a target of 5500*. The long-term target remains 5000*.
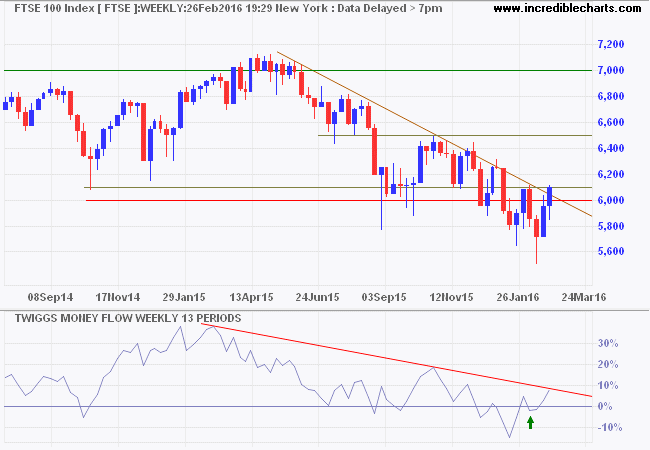
* Target calculation: 6000 - ( 6500 - 6000 ) = 5500
Asia
The Shanghai Composite Index rallied off support at 2700 but respected resistance at 3000. Reversal below support would offer a target of 2400*. The primary trend is clearly down and likely to remain so for some time.
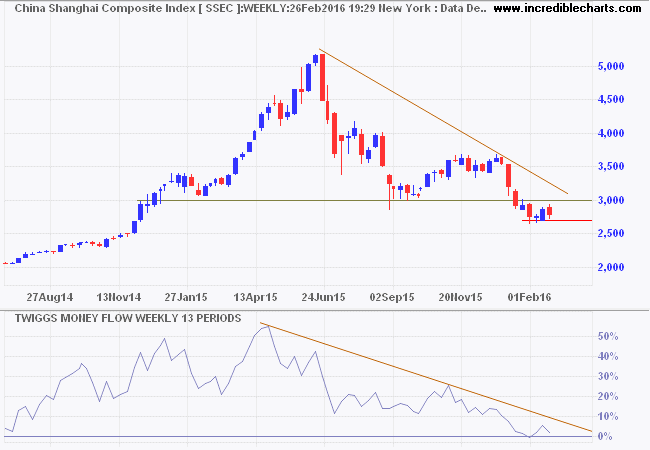
* Target calculation: 3000 - ( 3600 - 3000 ) = 2400
Japan's Nikkei 225 Index is in a clear primary down-trend. Expect a test of 17000/18000 but respect of 18000 would warn of another test of 15000. Decline of 13-week Twiggs Money Flow below zero would flag more selling pressure.
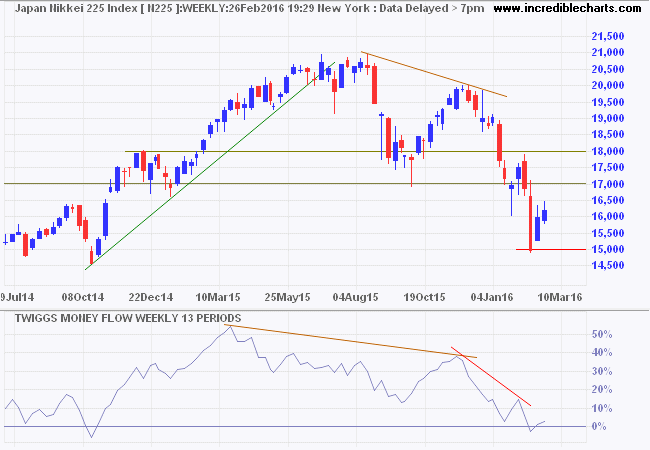
* Target calculation: 17000 - ( 20000 - 17000 ) = 14000
India's Sensex primary down-trend is accelerating, with failed swings to the upper trend channel. Breach of 23000 would offer a short-term target of 22000*. Reversal of 13-week Twiggs Money Flow below zero would warn of more selling pressure.
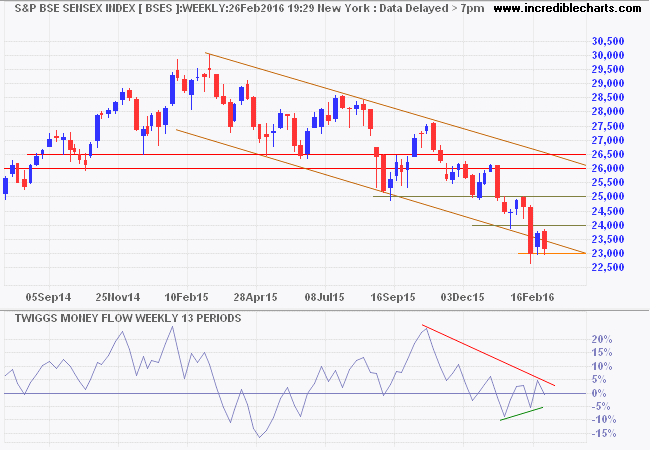
* Target calculation: 23000 - ( 24000 - 23000 ) = 22000
Australia
The ASX 200 rally from 4700 respected resistance at 5000. Reversal below 4900 warns of another decline. Breach of support at 4700 would confirm. Divergence on 13-week Twiggs Money Flow indicates medium-term (secondary) buying pressure and reversal below zero would flag another decline. The primary trend is down and breach of 4700 would offer a target of 4400*. The long-term target remains 4000*.
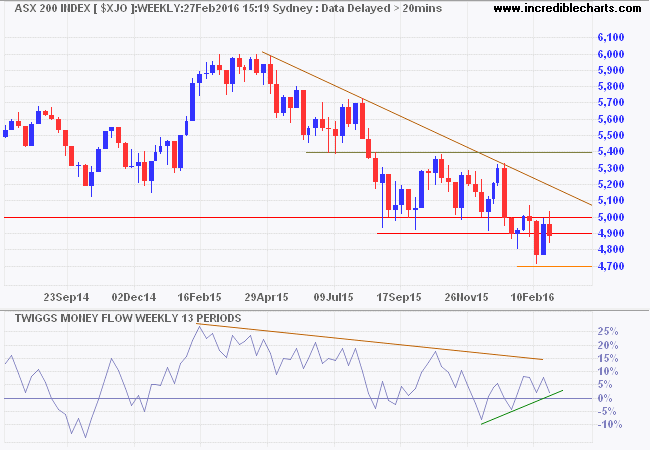
* Target calculation: 4700 - ( 5000 - 4700 ) = 4400; 5000 - ( 6000 - 5000 ) = 4000
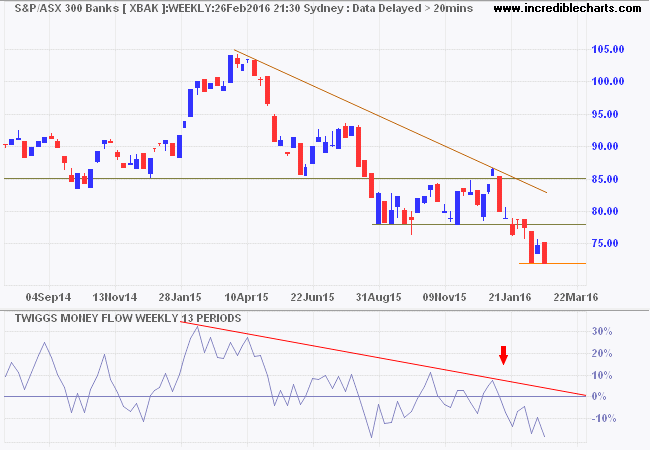
Banks are taking a hammering, with the Banks index (XBAK) in a clear down-trend. Retracement to test resistance at 78 is weak and another strong decline likely. Declining 13-week Twiggs Money Flow, below zero, reflects long-term selling pressure.
The most important rule is to play great defense, not great offense. Everyday I assume every position I have is wrong. I know where my stop risk points are going to be. I do that so I can define my maximum drawdown. Hopefully, I spend the rest of the day enjoying positions that are going in my direction. If they are going against me, then I have a game plan for getting out.
~ Paul Tudor Jones
Disclaimer
Porter Private Clients Pty Ltd, trading as Research & Investment ("R&I"), is a Corporate Authorized Representative (AR Number 384 397) of Andika Pty Ltd which holds an Australian Financial Services Licence (AFSL 297069).
The information on this web site and in the newsletters is general in nature and does not consider your personal circumstances. Please contact your professional financial adviser for advice tailored to your needs.
R&I has made every effort to ensure the reliability of the views and recommendations expressed in the reports published on its websites and newsletters. Our research is based upon information known to us or which was obtained from sources which we believe to be reliable and accurate.
No guarantee as to the capital value of investments, nor future returns are made by R&I. Neither R&I nor its employees make any representation, warranty or guarantee that the information provided is complete, accurate, current or reliable.
You are under no obligation to use these services and should always compare financial services/products to find one which best meets your personal objectives, financial situation or needs.
To the extent permitted by law, R&I and its employees, agents and authorised representatives exclude all liability for any loss or damage (including indirect, special or consequential loss or damage) arising from the use of, or reliance on, any information. If the law prohibits the exclusion of such liability, such liability shall be limited, to the extent permitted by law, to the resupply of the said information or the cost of the said resupply.
Important Warning About Simulated Results
Research & Investment (R&I) specialise in developing, testing and researching investment strategies and systems. Within the R&I web site and newsletters, you will find information about investment strategies and their performance. It is important that you understand that results from R&I research are simulated and not actual results.
No representation is made that any investor will or is likely to achieve profits or losses similar to those shown.
Simulated performance results are generally prepared with the benefit of hindsight and do not involve financial risk. No modeling can completely account for the impact of financial risk in actual investment. Account size, brokerage and slippage may also diverge from simulated results. Numerous other factors related to the markets in general or to the implementation of any specific investment system cannot be fully accounted for in the preparation of simulated performance results and may adversely affect actual investment results.
To the extent permitted by law, R&I and its employees, agents and authorised representatives exclude all liability for any loss or damage (including indirect, special or consequential loss or damage) arising from the use of, or reliance on, any information offered by R&I whether or not caused by any negligent act or omission.

Author: Colin Twiggs is a former investment banker with almost 40 years of experience in financial markets. He co-founded Incredible Charts and writes the popular Trading Diary and Patient Investor newsletters.
Using a top-down approach, Colin identifies key macro trends in the global economy before evaluating selected opportunities using a combination of fundamental and technical analysis.
Focusing on interest rates and financial market liquidity as primary drivers of the economic cycle, he warned of the 2008/2009 and 2020 bear markets well ahead of actual events.
He founded PVT Capital (AFSL No. 546090) in May 2023, which offers investment strategy and advice to wholesale clients.
