The illusion of unstoppable Chinese growth
By Colin Twiggs
September 3rd, 2015 6:00 p.m. AEST (4:00 a.m. EDT)
Advice herein is provided for the general information of readers and does not have regard to any particular person's investment objectives, financial situation or needs. Accordingly, no reader should act on the basis of any information contained herein without first having consulted a suitably qualified financial advisor.
Throughout history, from Dutch tulips to South Sea investments, investors experiencing a bubble have refused to believe that it will end. Forecasters with the temerity to suggest otherwise were attacked and ridiculed. Denial is a powerful emotion.
The last three decades have been no different, as we moved through a succession of bubbles: from Japan in 1989/90, to the 1997/98 Asian crisis, to the Dotcom crash in 2000/01, and the GFC in 2007/08. All had the same primary cause: state interference with two major pricing mechanisms that allow markets to clear. Central bank suppression of interest rates fueled rapid debt growth and forced investors to assume greater risk in order to achieve a viable return, building huge imbalances within the economy. Suppression of exchange rates through accumulation of vast foreign reserves, primarily foreign debt, has also been used by emerging economies such as China to boost exports and maintain a current account surplus. But this ignores the inevitable feedback loop that results.
China's and other emerging markets current account surpluses caused the US to suffer a persistent current account deficit.
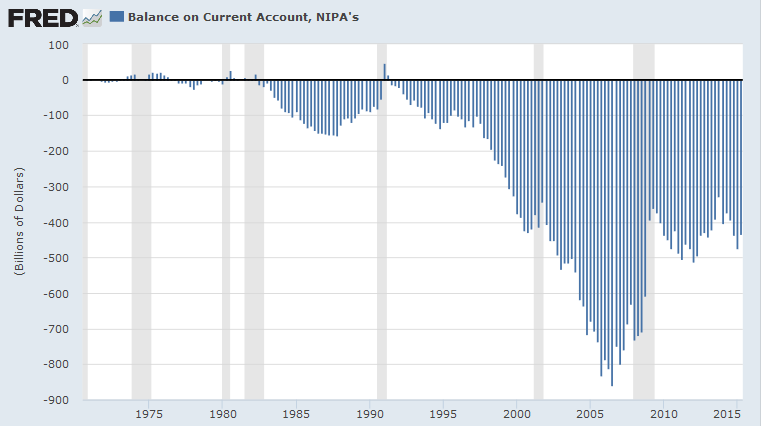
The effect on the US is twofold. First, a persistent current account deficit hurts economic growth. Second, foreign purchases of US debt suppress long-term interest rates. Like most central banks, the Fed preferred to address the symptoms (falling growth and rising unemployment) rather than address the underlying cause (if your only tool is a hammer then every problem starts to resemble a nail). Suppression of interest rates created a wash of easy money looking for a return. A large chunk of this flowed into China and other emerging markets — primarily as credit to domestic borrowers — taking advantage of low interest rates in the US and higher yields in these rapidly growing economies, while enjoying the protection of a currency pegged to the Dollar.
Now that the Fed is making noises about raising interest rates, margins are likely to be squeezed and the currency peg appears vulnerable. Recent capital outflows forced China to devalue the Yuan. But devaluation is likely to fuel further outflows. Supporting the currency — purchasing Yuan using China's more than $4 trillion of foreign reserves — may appear a simple solution but that contracts the amount of money in circulation, threatening deflation.
Attempts to stem the outgoing tide are likely to sap confidence and exacerbate the problem. China and other emerging markets can expect a hard landing. US and European markets survived the crises of 1989/90 and 1997/98 but global economies are now far more intertwined. I prefer to err on the side of caution.
North America
The S&P 500 respected the new resistance level at 2000, suggesting that the rally has failed. Wednesday's blue harami candle offers feint hope of a reversal, but the overriding trend is downward. Rising short sales warn of increased selling pressure. Recovery above 2000 is unlikely but would offer hope of a relieving rally. Breach of short-term support at 1900 would suggest another decline, while failure of 1870 would confirm.
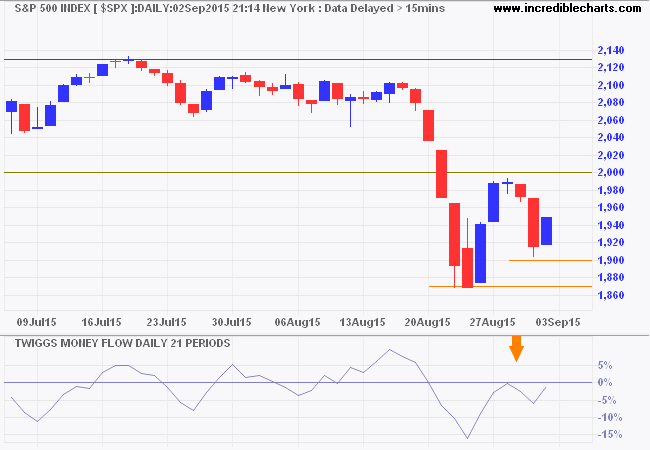
* Target calculation: 1900 - ( 2000 - 1900 ) = 1800
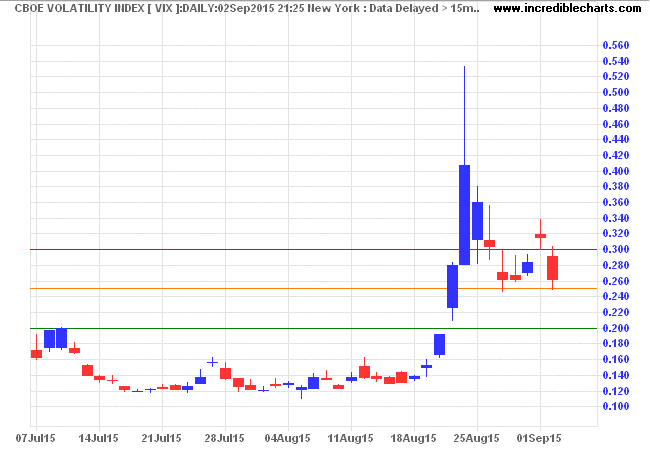
The CBOE Volatility Index (VIX) continues to indicate elevated market risk.
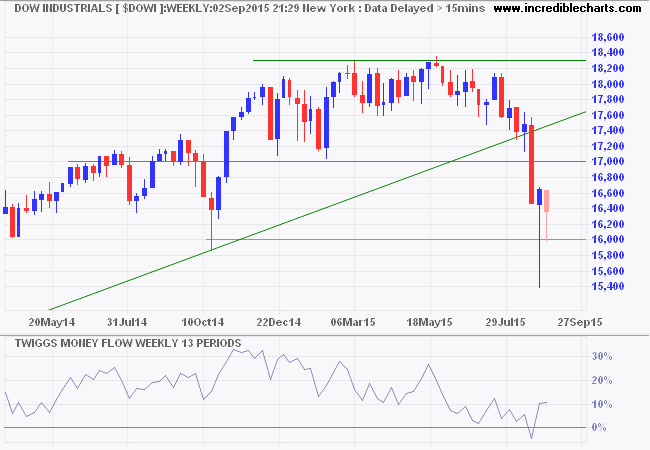
Dow Jones Industrial Average is in a similar position to the S&P 500. Breach of support at 16000 would confirm a primary down-trend. Recovery above 17000 is less likely, but would signal buying pressure.
Canada's TSX 60 rallied above resistance at 800 but has since reversed. Follow-through below say 790 would confirm the primary down-trend. Declining 13-week Twiggs Momentum below zero continues to warn of a down-trend. Recovery above 820 is less likely but would indicate buying pressure.
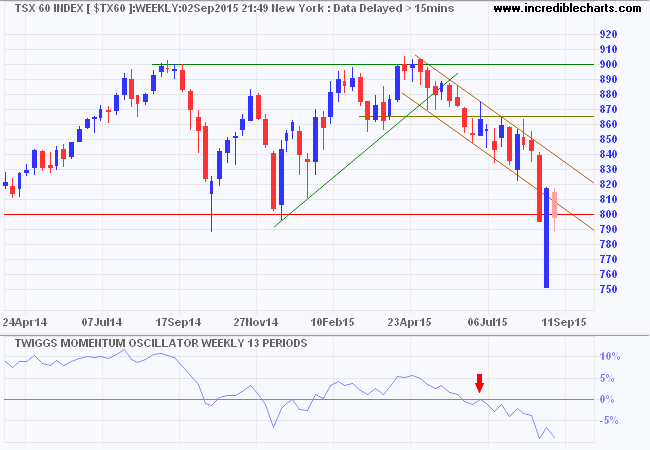
* Target calculation: 800 - ( 900 - 800 ) = 700
Europe
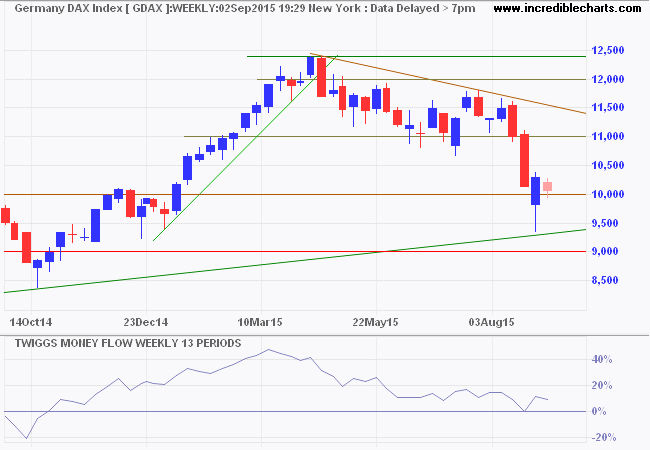
Germany's DAX recovered above support at 10000. Follow-through above last week's candle at 10500 would indicate a rally to test the descending trendline. Respect of the zero line by 13-week Twiggs Money Flow indicates medium-term buying pressure. Reversal below 10000 is less likely, but would warn of a primary down-trend.
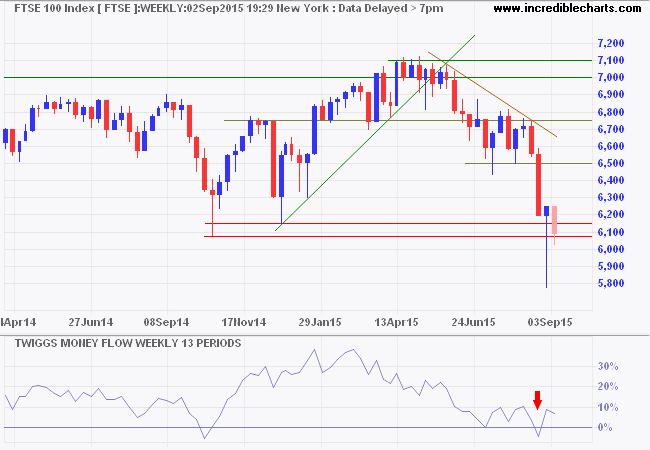
The Footsie is testing primary support at 6100. Reversal below that level would confirm a primary down-trend, while recovery above 6250 would indicate a rally to test 6500. Respect of the zero line by 13-week Twiggs Money Flow again indicates medium-term support.
Asia
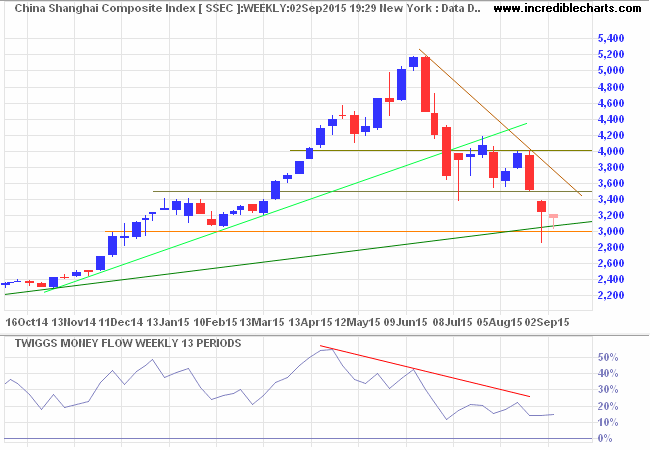
Chinese markets are closed Thursday and Friday for the World War II 70th Anniversary. The Shanghai Composite index is testing support at 3000. Intervention to support the market is unlikely to succeed. Reversal of 13-week Twiggs Money Flow below zero would confirm a primary down-trend.
Hong Kong's Hang Seng Index gives a clearer picture of investor sentiment without government intervention. Breach of support at 22500 and declining 13-week Twiggs Money Flow (below zero) both signal a primary down-trend. Failure of the next level of support at 21000 further strengthens the signal.
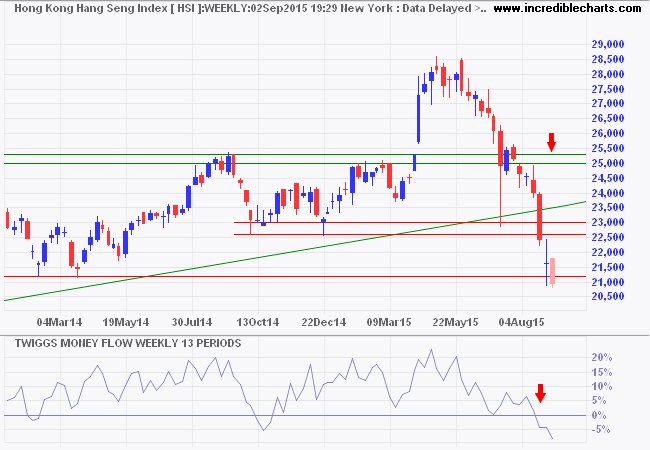
* Target calculation: 440 - ( 550 - 440 ) = 330
Japan's Nikkei 225 retreated below support at 19000 and is likely to test primary support at 17000. The gradual decline of 13-week Twiggs Money Flow indicates medium-term selling pressure — more a secondary correction than a primary reversal.
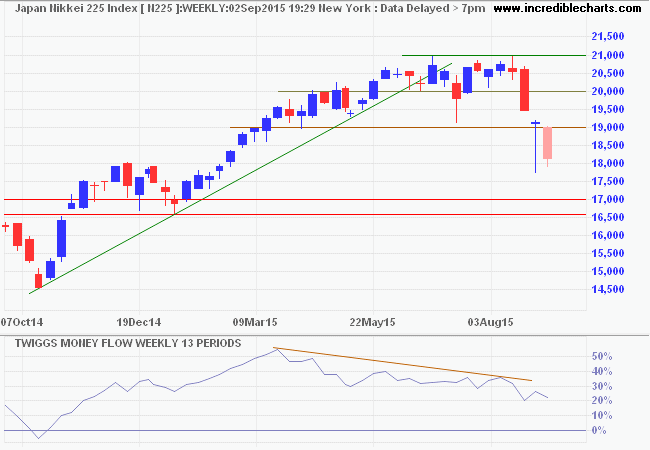
* Target calculation: 19000 - ( 21000 - 19000 ) = 17000
India's Sensex retreated below 26000, confirming a primary down-trend. Reversal of 13-week Twiggs Money Flow below zero would further strengthen the signal.
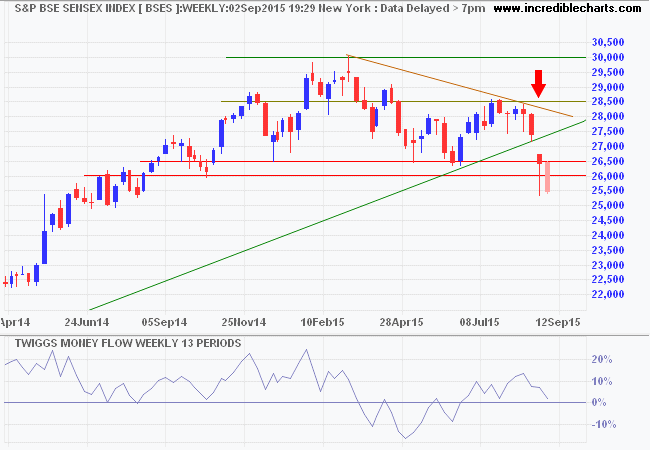
* Target calculation: 27000 - ( 30000 - 27000 ) = 24000
Australia
The ASX 200 is testing key support at 5000. Respect of the zero line (from below) on 21-day Twiggs Money Flow indicates selling pressure. Breach of 5000 is likely and would confirm a primary down-trend. Respect is unlikely, but would indicate another test of medium-term resistance at 5300.
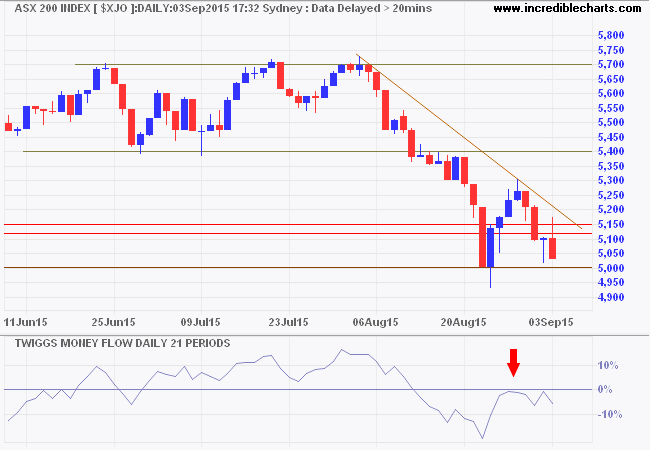
* Target calculation: 5000 - ( 5400 - 5000 ) = 4600
There is a theory which states that if ever anyone discovers exactly what the Universe is for and why it is here, it will instantly disappear and be replaced by something even more bizarre and inexplicable.
There is another theory which states that this has already happened.~ Douglas Adams: Hitchhiker's Guide to the Galaxy
Disclaimer
Research & Investment Pty Ltd is a Corporate Authorized Representative (AR Number 384 397) of Andika Pty Ltd which holds an Australian Financial Services Licence (AFSL 297069).
The information on this web site and in the newsletters is general in nature and does not consider your personal circumstances. Please contact your professional financial adviser for advice tailored to your needs.
Research & Investment Pty Ltd ("R&I") has made every effort to ensure the reliability of the views and recommendations expressed in the reports published on its websites and newsletters. Our research is based upon information known to us or which was obtained from sources which we believe to be reliable and accurate.
No guarantee as to the capital value of investments, nor future returns are made by R&I. Neither R&I nor its employees make any representation, warranty or guarantee that the information provided is complete, accurate, current or reliable.
You are under no obligation to use these services and should always compare financial services/products to find one which best meets your personal objectives, financial situation or needs.
To the extent permitted by law, R&I and its employees, agents and authorised representatives exclude all liability for any loss or damage (including indirect, special or consequential loss or damage) arising from the use of, or reliance on, any information. If the law prohibits the exclusion of such liability, such liability shall be limited, to the extent permitted by law, to the resupply of the said information or the cost of the said resupply.
Important Warning About Simulated Results
Research & Investment (R&I) specialise in developing, testing and researching investment strategies and systems. Within the R&I web site and newsletters, you will find information about investment strategies and their performance. It is important that you understand that results from R&I research are simulated and not actual results.
No representation is made that any investor will or is likely to achieve profits or losses similar to those shown.
Simulated performance results are generally prepared with the benefit of hindsight and do not involve financial risk. No modeling can completely account for the impact of financial risk in actual investment. Account size, brokerage and slippage may also diverge from simulated results. Numerous other factors related to the markets in general or to the implementation of any specific investment system cannot be fully accounted for in the preparation of simulated performance results and may adversely affect actual investment results.
To the extent permitted by law, R&I and its employees, agents and authorised representatives exclude all liability for any loss or damage (including indirect, special or consequential loss or damage) arising from the use of, or reliance on, any information offered by R&I whether or not caused by any negligent act or omission.

Author: Colin Twiggs is a former investment banker with almost 40 years of experience in financial markets. He co-founded Incredible Charts and writes the popular Trading Diary and Patient Investor newsletters.
Using a top-down approach, Colin identifies key macro trends in the global economy before evaluating selected opportunities using a combination of fundamental and technical analysis.
Focusing on interest rates and financial market liquidity as primary drivers of the economic cycle, he warned of the 2008/2009 and 2020 bear markets well ahead of actual events.
He founded PVT Capital (AFSL No. 546090) in May 2023, which offers investment strategy and advice to wholesale clients.
