Signs of improvement
By Colin Twiggs
August 6th, 2015 6:00 p.m. AET (4:00 a.m. EDT)
Advice herein is provided for the general information of readers and does not have regard to any particular person's investment objectives, financial situation or needs. Accordingly, no reader should act on the basis of any information contained herein without first having consulted a suitably qualified financial advisor.
Performance
The S&P 500 Prime Momentum strategy returned +29.36%* for the 12 months ended 31st July 2015, compared to +11.21% for the S&P 500 Total Return Index.
The ASX200 Prime Momentum strategy returned -6.30%* for the 12 months ended 31st July 2015 compared to +5.68% for the ASX 200 Accumulation Index.
Our macroeconomic and volatility filters indicate moderate risk and we maintain full exposure to equities. The ASX portfolio has suffered from stock market turbulence in recent months but the time horizon for the investment is 5 years or longer and short-term underperformance is likely to reverse when the market regains direction.
Splitting investment between the ASX 200 and S&P 500 strategies would enhance diversification and help to reduce volatility.
* Results are unaudited and subject to revision.
North America
Earnings results for the second quarter of 2015 remain on track. Of the 354 stocks in the S&P 500 that have reported, 252 (71%) beat, 26 met and 76 (21%) missed their estimates.
The S&P 500 has lost momentum since March 2015, consolidating below resistance at 2130. Gradual decline of 13-week Twiggs Money Flow suggests buyers remain interested and this is a secondary formation. Breakout above 2130 would signal an advance to 2200*, but there is no indication that this is imminent. Reversal below support at 2040/2050 is unlikely, but penetration of the rising trendline would warn of a reversal — confirmed if support at 1980/2000 is breached.
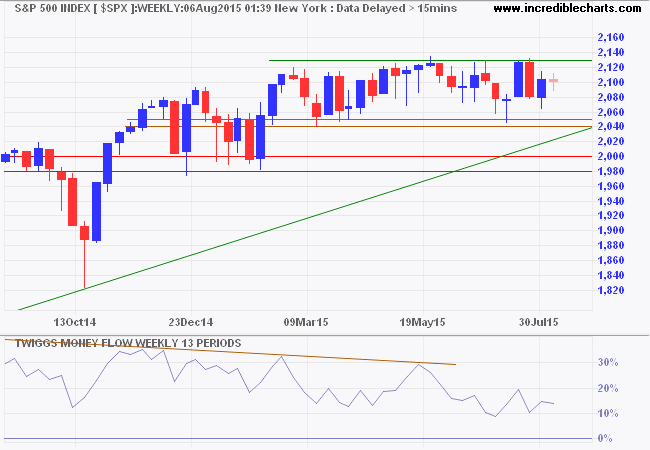
* Target calculation: 2130 + ( 2130 - 2050 ) = 2210
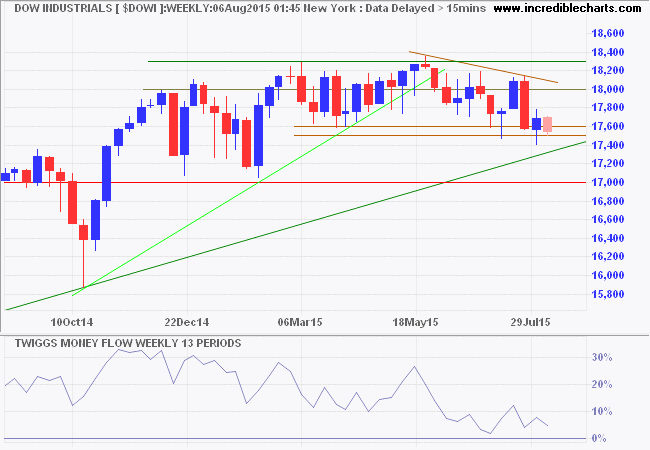
Dow Jones Industrial Average is weaker than the S&P 500. Breach of support at 17500 would test primary support at 17000. Reversal of 13-week Twiggs Money Flow below zero would warn of selling pressure.
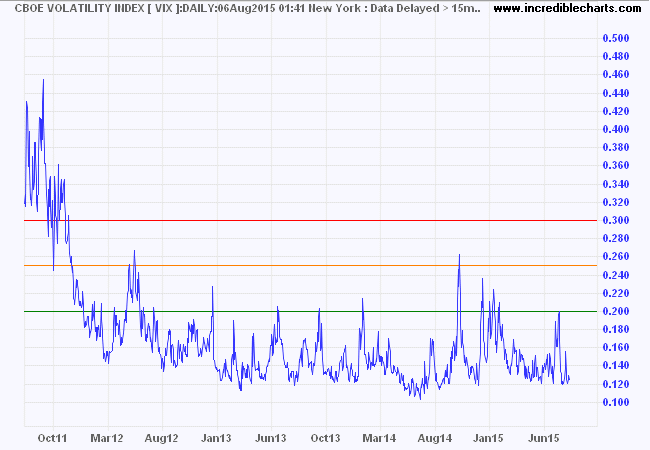
The CBOE Volatility Index (VIX) remains low — typical of a bull market.
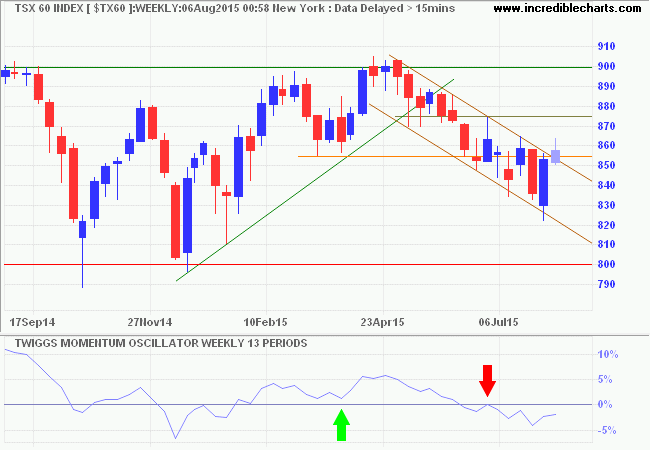
Canada's TSX 60 broke through the upper trend channel, suggesting the correction is over. Follow-through above 875 would indicate another test of 900. Recovery of 13-week Twiggs Momentum above zero would strengthen the signal.
Europe improving
Germany's DAX respected support at 11000. Follow-through above 11800 would indicate another test of 12400. Rising 13-week Twiggs Money Flow indicates medium-term buying pressure.
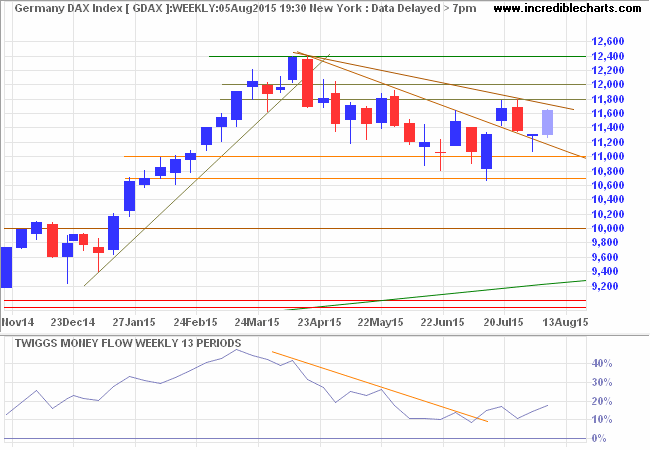
* Target calculation: 12500 + ( 12500 - 11000 ) = 14000
The Footsie similarly respected support at 6500. Follow-through above 6800 would complete a double bottom reversal, indicating a test of 7100. A 13-week Twiggs Money Flow trough above zero flags buying pressure.
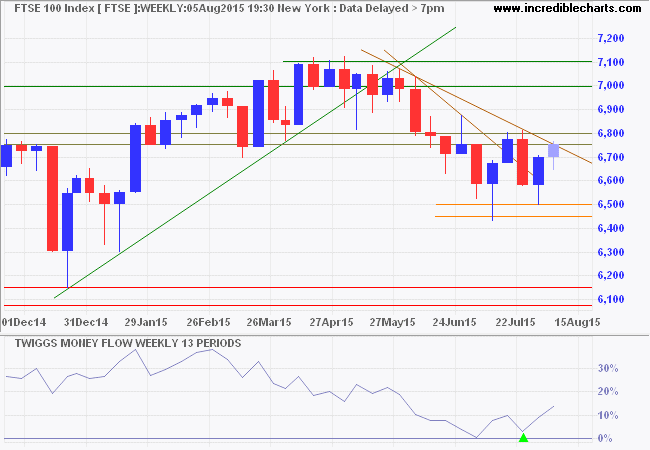
* Target calculation: 7000 + ( 7000 - 6500 ) = 7500
Asia
The Shanghai Composite continues to reflect selling pressure with declining 13-week Twiggs Money Flow. Withdrawal of government support is unlikely, but would cause a breach of 3400/3500.
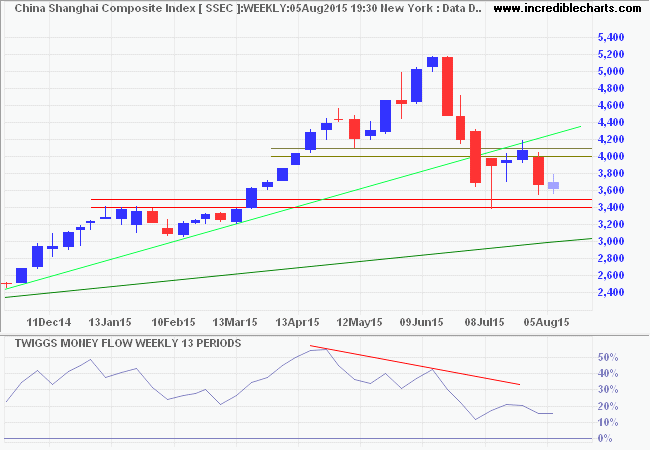
* Target calculation: 4000 - ( 5000 - 4000 ) = 3000
Japan's Nikkei 225 is respected support at 20000, indicating another test of 21000. Breakout above 21000 would offer a target of 23000*. Decline of 13-week Twiggs Money Flow has leveled off. Reversal below support at 20000 is unlikely but would warn of another test of 19000.
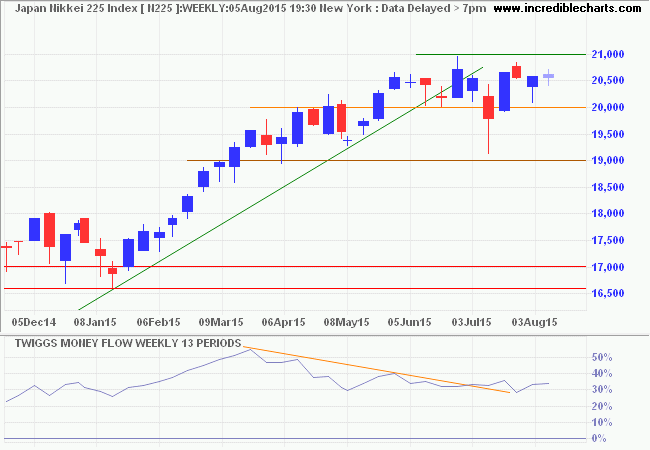
* Target calculation: 21000 + ( 21000 - 19000 ) = 23000
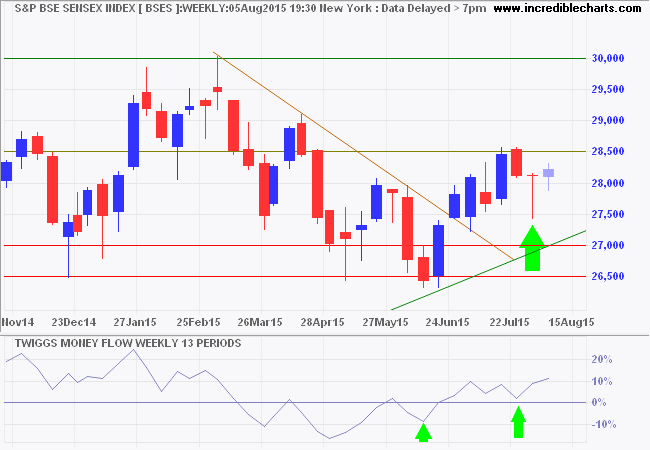
A higher trough on India's Sensex suggests buying pressure. Rising 13-week Twiggs Money Flow confirms. Breakout above 28500 would signal another test of 30000. Decline below 27000 is unlikely.
Australia
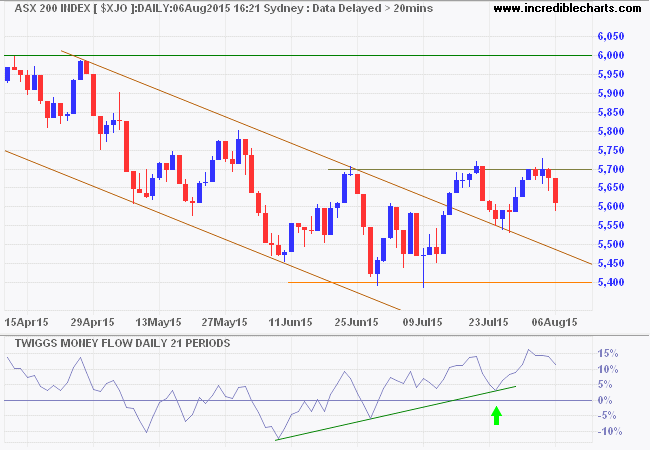
The ASX 200 encountered stubborn resistance at 5700. Rising troughs on 21-day Twiggs Money Flow continue to indicate buying pressure. Respect of support at 5550 would be bullish, while breakout above 5700 would indicate another test of 6000. Failure of 5550 is less likely, but would test medium-term support at 5400.
I find the idea that you can introduce democracy by military force a very quaint idea. Moreover, if I wanted to choose a testing ground for doing it, Iraq would be the last nation I would choose.
~ George Soros (2004)
Disclaimer
Research & Investment Pty Ltd is a Corporate Authorized Representative (AR Number 384 397) of Andika Pty Ltd which holds an Australian Financial Services Licence (AFSL 297069).
The information on this web site and in the newsletters is general in nature and does not consider your personal circumstances. Please contact your professional financial adviser for advice tailored to your needs.
Research & Investment Pty Ltd ("R&I") has made every effort to ensure the reliability of the views and recommendations expressed in the reports published on its websites and newsletters. Our research is based upon information known to us or which was obtained from sources which we believe to be reliable and accurate.
No guarantee as to the capital value of investments, nor future returns are made by R&I. Neither R&I nor its employees make any representation, warranty or guarantee that the information provided is complete, accurate, current or reliable.
You are under no obligation to use these services and should always compare financial services/products to find one which best meets your personal objectives, financial situation or needs.
To the extent permitted by law, R&I and its employees, agents and authorised representatives exclude all liability for any loss or damage (including indirect, special or consequential loss or damage) arising from the use of, or reliance on, any information. If the law prohibits the exclusion of such liability, such liability shall be limited, to the extent permitted by law, to the resupply of the said information or the cost of the said resupply.
Important Warning About Simulated Results
Research & Investment (R&I) specialise in developing, testing and researching investment strategies and systems. Within the R&I web site and newsletters, you will find information about investment strategies and their performance. It is important that you understand that results from R&I research are simulated and not actual results.
No representation is made that any investor will or is likely to achieve profits or losses similar to those shown.
Simulated performance results are generally prepared with the benefit of hindsight and do not involve financial risk. No modeling can completely account for the impact of financial risk in actual investment. Account size, brokerage and slippage may also diverge from simulated results. Numerous other factors related to the markets in general or to the implementation of any specific investment system cannot be fully accounted for in the preparation of simulated performance results and may adversely affect actual investment results.
To the extent permitted by law, R&I and its employees, agents and authorised representatives exclude all liability for any loss or damage (including indirect, special or consequential loss or damage) arising from the use of, or reliance on, any information offered by R&I whether or not caused by any negligent act or omission.

Author: Colin Twiggs is a former investment banker with almost 40 years of experience in financial markets. He co-founded Incredible Charts and writes the popular Trading Diary and Patient Investor newsletters.
Using a top-down approach, Colin identifies key macro trends in the global economy before evaluating selected opportunities using a combination of fundamental and technical analysis.
Focusing on interest rates and financial market liquidity as primary drivers of the economic cycle, he warned of the 2008/2009 and 2020 bear markets well ahead of actual events.
He founded PVT Capital (AFSL No. 546090) in May 2023, which offers investment strategy and advice to wholesale clients.
