Greece and Iran party but China lurks in the shadows
By Colin Twiggs
July 16th, 2015 5:30 p.m. AET (3:30 a.m. EDT)
Advice herein is provided for the general information of readers and does not have regard to any particular person's investment objectives, financial situation or needs. Accordingly, no reader should act on the basis of any information contained herein without first having consulted a suitably qualified financial advisor.
Performance Update
The S&P 500 Prime Momentum strategy returned +22.67%* for the 12 months ended 30th June 2015, outperforming the S&P 500 Total Return Index by 15.25%. Macroeconomic and volatility filters continue to indicate low to moderate risk and we maintain full exposure to equities.
The ASX200 Prime Momentum strategy returned -4.02%* for the 12 months ended 30th June 2015. Underperformance is primarily attributable to sharp falls in Sirtex (SRX) and Resmed (RMD) after disappointing clinical trials. Concentrated portfolios are always more volatile because of high exposures to individual stocks, but they also tend to perform better in the long-term — which is why we recommend a minimum investment horizon of 5 years.
Splitting your investment between the ASX 200 and S&P 500 strategies would enhance diversification and help to reduce volatility.
* Results are unaudited and subject to revision.
Greece and Iran
From the Wall Street Journal:
Greece's Parliament passed early Thursday a crucial set of austerity measures required for a eurozone bailout package....The measures were supported by 229 lawmakers in the nation's 300-seat Parliament.
A Grexit has been avoided for the present, but unless the Greeks are successful in implementing structural reform, reversing many years of cronyism and corruption, we are likely to witness further re-runs in the future.
The nuclear deal with Iran has outraged the Right in Israel and the US. There are many pitfalls along the way but I believe this is a bold step forward. The outcome will be uncertain for many years but presents both sides with a chance to build a new relationship where they can peacefully co-exist. The alternative is another war in the Middle East — with no winners.

Photos: exuberant Iranians celebrate the nuclear deal http://t.co/RBqvCR6Vm0 pic.twitter.com/fUfvelIeP5
— Quartz (@qz) July 16, 2015I was surprised to see the Russians playing a constructive role in the dialogue. I am sure that Vladimir Putin would take personal delight in poking a stick through Obama's bicycle spokes, but the interests of the state come first. "Follow the green" as one US diplomat described it. The New York Times offers a clue:
Sergey V. Lavrov, the Russian foreign minister, lost no time in talking about the accord on Iran's nuclear program. He was on television minutes after the deal was clinched, and even before the formal news conference had begun, announcing the landmark agreement to the audience back home and emphasizing the many potential benefits, strategic and economic, that it holds for Russia.....Russia possesses some of the world's foremost expertise in atomic energy, and has helped build and operate atomic reactors in Iran for many years. Rosatom, the Russian state nuclear energy company, helped build and expand the Bushehr nuclear plant and already has contracts to build two more reactors there.
China, on the other hand still lurks in the background. The state managed to stem the flood, suspending trading on more than 50% of stocks and forbidding large stockholders from selling. This is a public acknowledgment that Chinese stock prices are artificial and in no way to be trusted ("What's new" some cynics would ask). They have destroyed any credibility that their stock markets had. Japan had zombie banks after their 1990 stock market crash, solvent in name only. China seems to be following a similar path with zombie stocks. Banks who have lent money against those stocks are likely to follow.
For a deeper understanding of the situation, read China's stock market falling off a cliff: Why, and why care? by Alicia Garcia-Herrero at Bruegel.org
Europe
Germany's DAX recovered above its descending trendline, indicating the end of the correction. Follow-through above 11600 would strengthen the signal, suggesting a fresh advance. Breakout above 12400 would confirm. Recovery of 13-week Twiggs Money Flow above its descending trendline shows that selling pressure has eased.
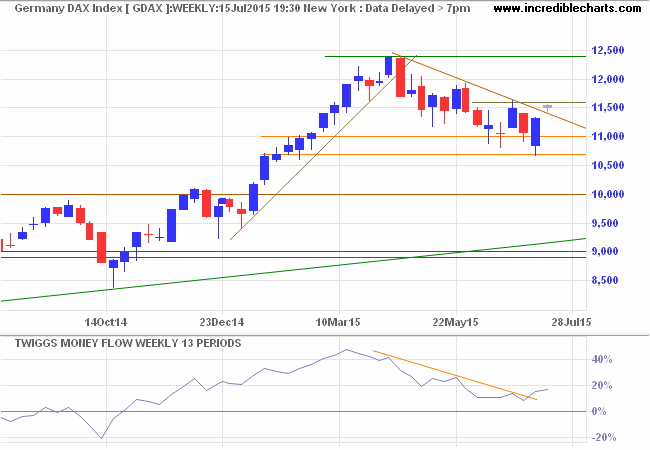
* Target calculation: 12500 + ( 12500 - 11000 ) = 14000
The Footsie also recovered above its descending trendline. Follow-through above 6750 would indicate another attempt at 7100. A 13-week Twiggs Money Flow trough at zero flags buying pressure.
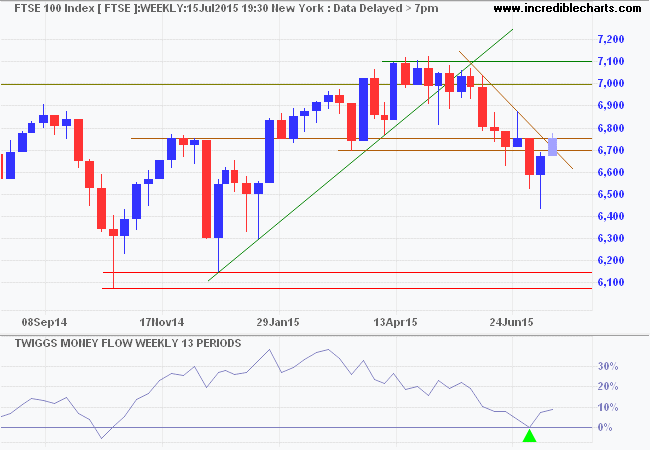
* Target calculation: 7000 + ( 7000 - 6500 ) = 7500
Asia
The Shanghai Composite is testing resistance at 4000. Government efforts to stem the crash are unlikely to restore credibility to stock prices. The large divergence on 13-week Twiggs Money Flow continues to warn of selling pressure.
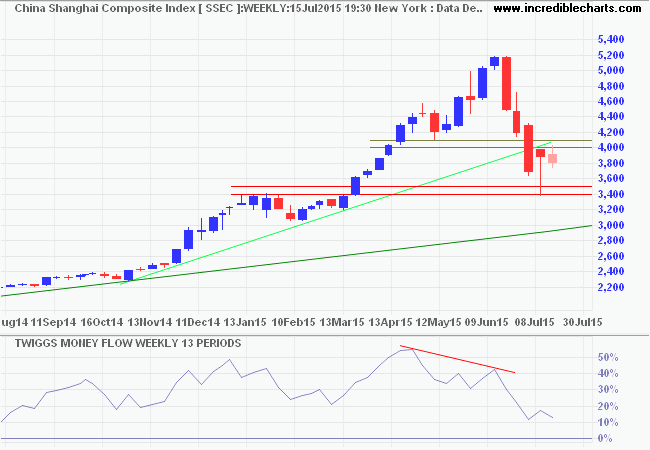
* Target calculation: 4000 - ( 5000 - 4000 ) = 3000
Japan's Nikkei 225 recovered above 20000, suggesting a fresh advance. Breakout above 21000 would confirm. Recovery of 13-week Twiggs Money Flow above its descending trendline suggests the correction is over.
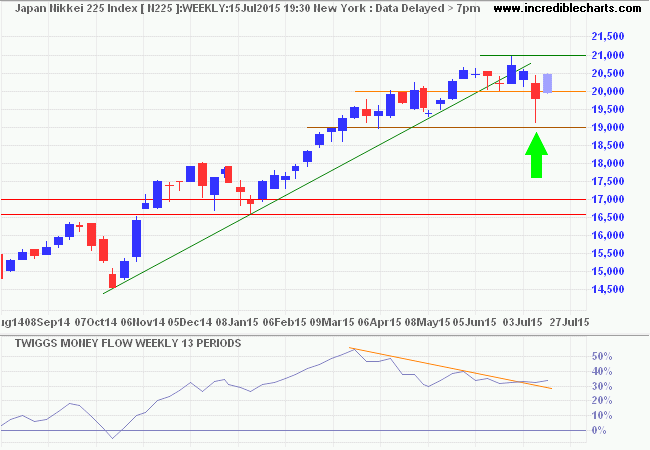
* Target calculation: 21000 + ( 21000 - 19000 ) = 23000
India's Sensex recovered above 28000, suggesting a fresh advance. A 13-week Twiggs Money Flow recovery above zero indicates medium-term buying pressure. Breach of primary support at 26500 is now unlikely.
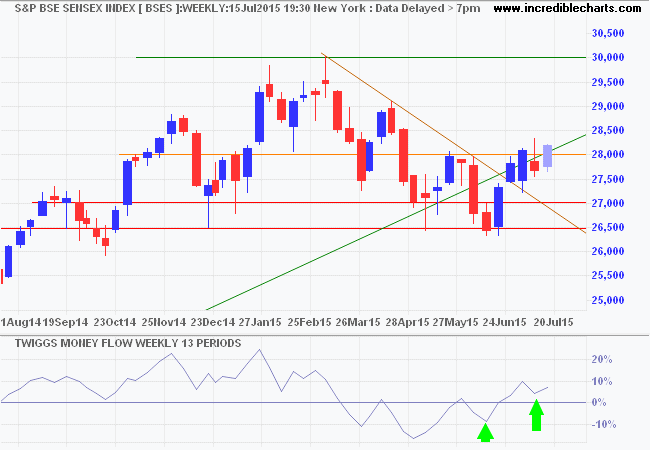
* Target calculation: 30000 + ( 30000 - 27000 ) = 33000
North America
The S&P 500 respected medium-term support at 2040. Another 13-week Twiggs Money Flow trough above zero would confirm long-term buying pressure. Breakout above 2120 would offer a target of 2200*.
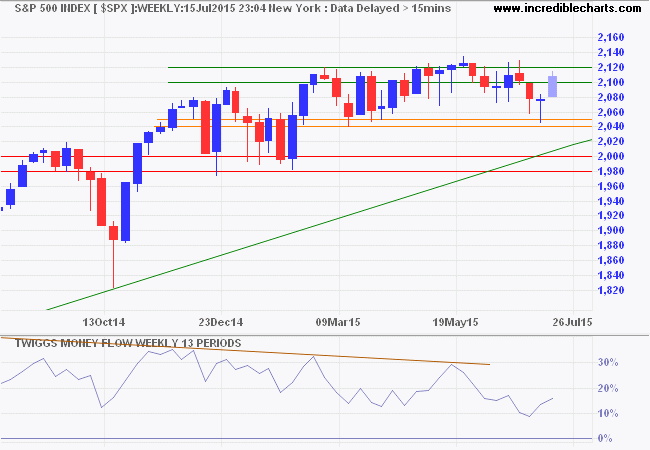
* Target calculation: 2100 + ( 2100 - 2000 ) = 2200
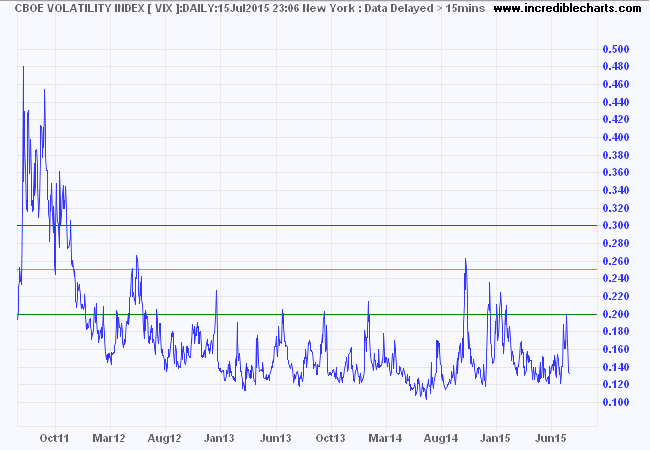
The CBOE Volatility Index (VIX) retreated to low levels typical of a bull market.
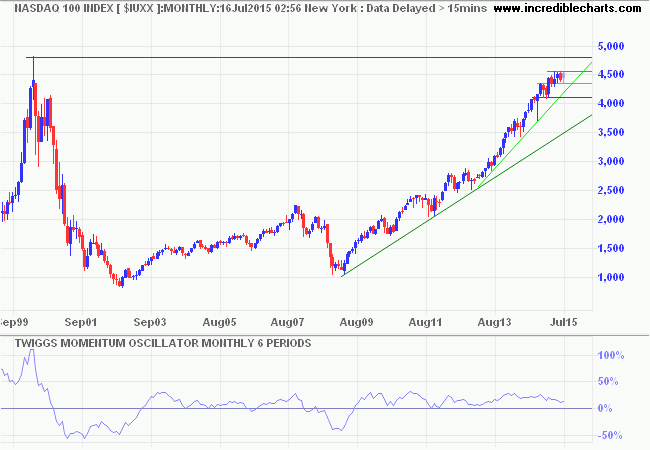
The Nasdaq 100 is approaching its Dotcom-era high of 4800. Breakout above 4550 would signal a test of long-term resistance. 6-Month Twiggs Momentum oscillating above zero reflects a healthy long-term up-trend.
Canada's TSX 60 recovered above support at 850/855. Breakout above the upper trend channel would indicate the correction is over, suggesting another test of 900. Recovery of 13-week Twiggs Momentum above zero would strengthen the signal. Respect of the upper trend channel is unlikely, but would warn of continuation of the down-trend.
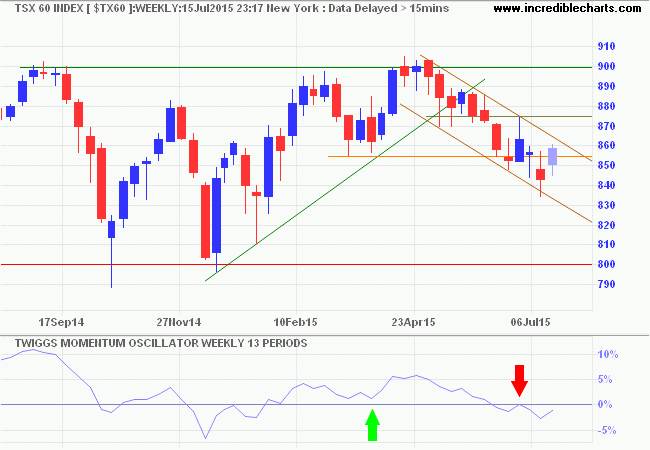
* Target calculation: 900 + ( 900 - 850 ) = 950
Australia
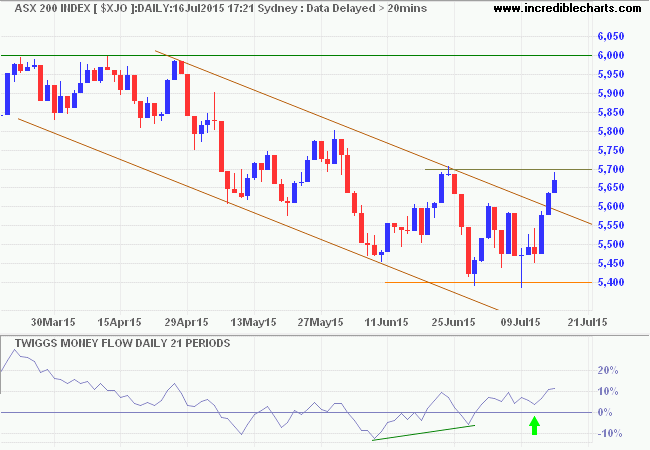
The ASX 200 broke out above its descending trend channel, flagging end of the correction. A 21-day Twiggs Money Flow trough above zero indicates medium-term buying pressure. Follow through above 5700 would signal another test of 6000.
Markets are constantly in a state of uncertainty and flux and money is made by discounting the obvious and betting on the unexpected.
~ George Soros
Disclaimer
Research & Investment Pty Ltd is a Corporate Authorized Representative (AR Number 384 397) of Andika Pty Ltd which holds an Australian Financial Services Licence (AFSL 297069).
The information on this web site and in the newsletters is general in nature and does not consider your personal circumstances. Please contact your professional financial adviser for advice tailored to your needs.
Research & Investment Pty Ltd ("R&I") has made every effort to ensure the reliability of the views and recommendations expressed in the reports published on its websites and newsletters. Our research is based upon information known to us or which was obtained from sources which we believe to be reliable and accurate.
No guarantee as to the capital value of investments, nor future returns are made by R&I. Neither R&I nor its employees make any representation, warranty or guarantee that the information provided is complete, accurate, current or reliable.
You are under no obligation to use these services and should always compare financial services/products to find one which best meets your personal objectives, financial situation or needs.
To the extent permitted by law, R&I and its employees, agents and authorised representatives exclude all liability for any loss or damage (including indirect, special or consequential loss or damage) arising from the use of, or reliance on, any information. If the law prohibits the exclusion of such liability, such liability shall be limited, to the extent permitted by law, to the resupply of the said information or the cost of the said resupply.
Important Warning About Simulated Results
Research & Investment (R&I) specialise in developing, testing and researching investment strategies and systems. Within the R&I web site and newsletters, you will find information about investment strategies and their performance. It is important that you understand that results from R&I research are simulated and not actual results.
No representation is made that any investor will or is likely to achieve profits or losses similar to those shown.
Simulated performance results are generally prepared with the benefit of hindsight and do not involve financial risk. No modeling can completely account for the impact of financial risk in actual investment. Account size, brokerage and slippage may also diverge from simulated results. Numerous other factors related to the markets in general or to the implementation of any specific investment system cannot be fully accounted for in the preparation of simulated performance results and may adversely affect actual investment results.
To the extent permitted by law, R&I and its employees, agents and authorised representatives exclude all liability for any loss or damage (including indirect, special or consequential loss or damage) arising from the use of, or reliance on, any information offered by R&I whether or not caused by any negligent act or omission.

Author: Colin Twiggs is a former investment banker with almost 40 years of experience in financial markets. He co-founded Incredible Charts and writes the popular Trading Diary and Patient Investor newsletters.
Using a top-down approach, Colin identifies key macro trends in the global economy before evaluating selected opportunities using a combination of fundamental and technical analysis.
Focusing on interest rates and financial market liquidity as primary drivers of the economic cycle, he warned of the 2008/2009 and 2020 bear markets well ahead of actual events.
He founded PVT Capital (AFSL No. 546090) in May 2023, which offers investment strategy and advice to wholesale clients.
