A tale of two economies
By Colin Twiggs
December 1st, 2014 11:30 a.m. AEDT (7:30 p.m. ET)
Advice herein is provided for the general information of readers and does not have regard to any particular person's investment objectives, financial situation or needs. Accordingly, no reader should act on the basis of any information contained herein without first having consulted a suitably qualified financial advisor.
S&P 500 Momentum performance
Research & Investment's S&P 500 Momentum strategy returned 17.82% since inception on 4th November 2013, or 19.82% when measured in Australian dollars. The S&P 500 Total Return Index delivered 20.42% (in USD) over the same period.
The ASX 200 strategy results will only be available on Tuesday, but are likely to be disappointing, given the performance of the ASX 200 index. Divergence between the two markets is expected to continue and investors should consider at least splitting their investment.
A tale of two economies
Stock markets in Western Europe and Asia are rallying on the strength of falling oil prices, joining the US in a bull trend. But primary producers, largely dependent on commodity exports, are likely to suffer as a result of falling prices. Australia is no exception.
The S&P 500 continues a primary advance. A conservative target would be 2200*. Rising 13-week Twiggs Money Flow indicates medium-term buying support. Reversal below 2000 is unlikely, but would warn of another correction.
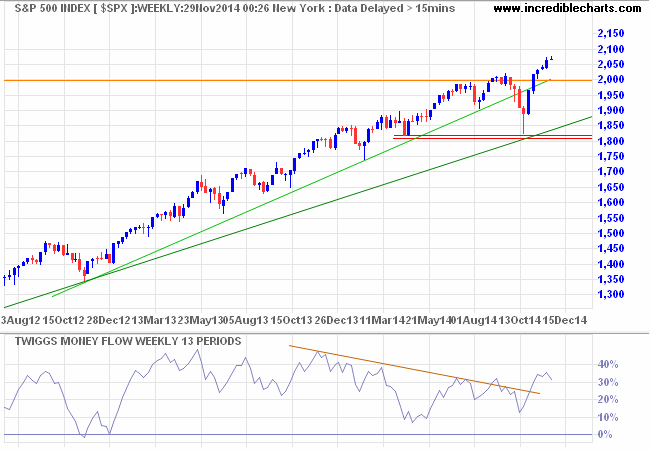
* Target calculation: 2000 + ( 2000 - 1800 ) = 2200
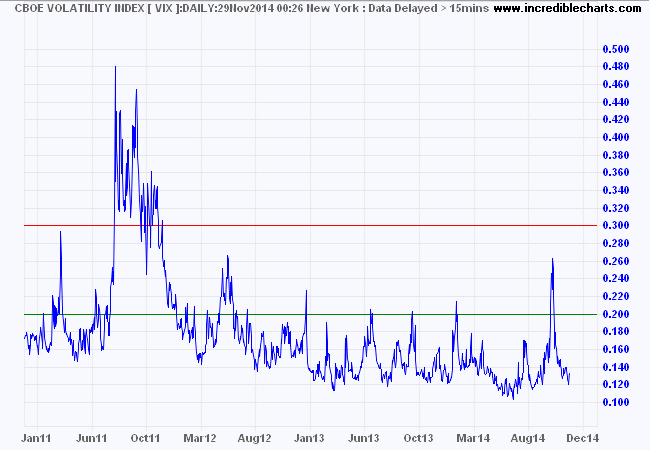
CBOE Volatility Index (VIX) indicates low risk typical of a bull market.
Germany's DAX is testing resistance at its earlier high of 10000. Recovery of 13-week Twiggs Money Flow above the declining trendline suggests medium-term buying pressure. Breakout above resistance would offer a conservative target of 11000*. Reversal below 9000 is unlikely, but would warn of a primary down-trend.
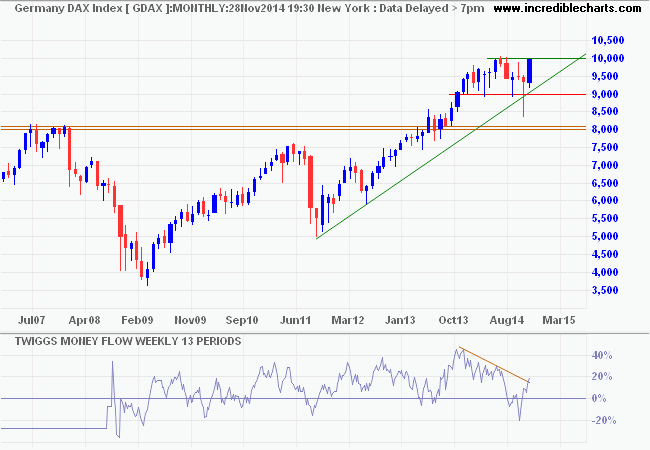
* Target calculation: 10000 + ( 10000 - 9000 ) = 11000
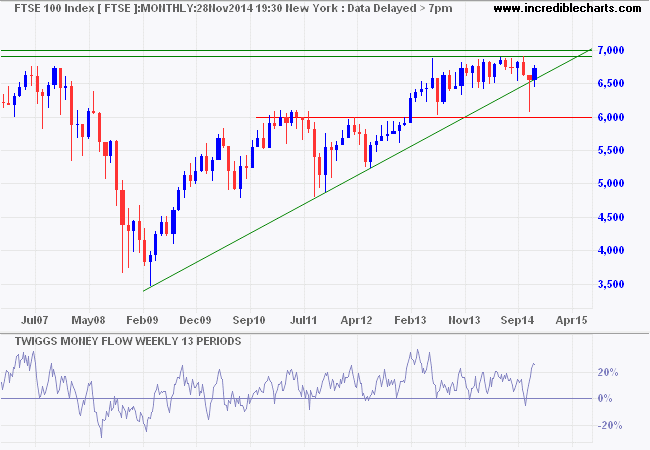
The Footsie is also testing long-term resistance on the monthly chart — at 6900/7000. The sharp rise on 13-Week Twiggs Money Flow indicates strong medium-term buying pressure, but resistance at the December 1999 high is likely to be solid. Reversal below 6500 remains unlikely.
China's Shanghai Composite Index cleared resistance at 2440/2500, signaling a primary up-trend. 13-Week Twiggs Money Flow respect of its rising trendline confirms (medium-term) buying pressure. I remain wary of China. The recent rate-cut by the PBOC is cause for concern, not jubilation.
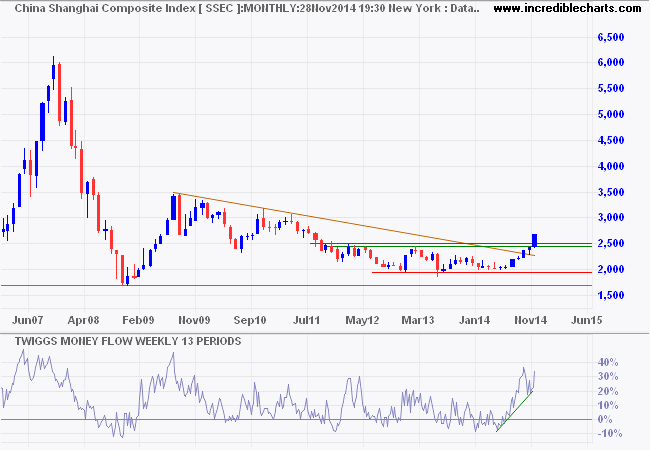
* Target calculation: 2500 + ( 2500 - 2000 ) = 3000
Japan's Nikkei 225 Index is headed for long-term resistance at 18000. 13-Week Twiggs Money Flow oscillating above the zero line indicates long-term buying pressure. Reversal below 16500 is unlikely.
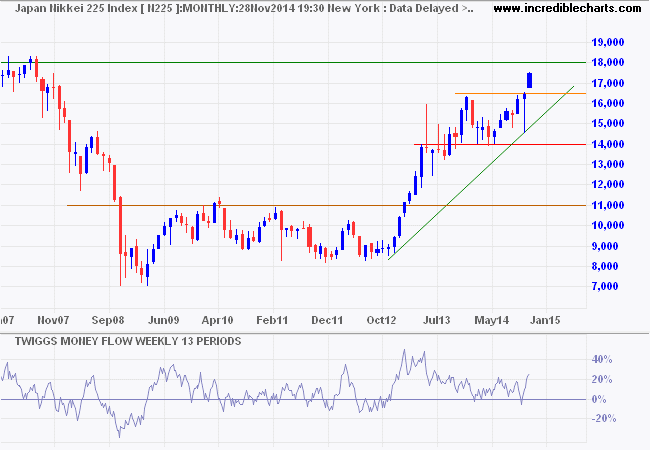
* Target calculation: 16000 + ( 16000 - 14000 ) = 18000
The ASX 200 is undergoing another correction. Respect of support at 5250/5300 would indicate the primary up-trend is intact — but 13-week Twiggs Money Flow reversal below zero warns of strong selling pressure. Breach of support is likely and would warn of a test of 5000.
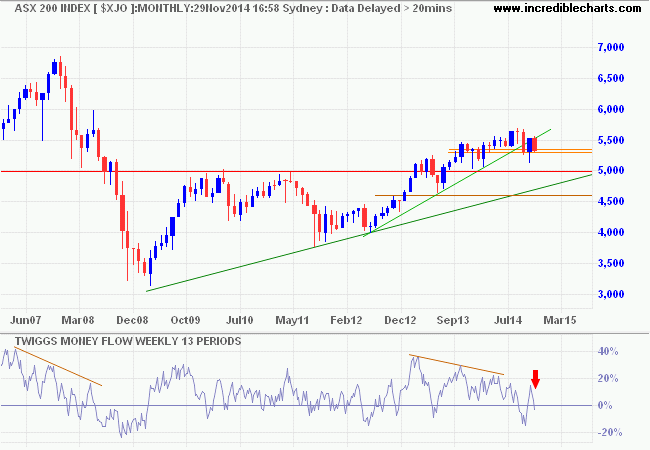
* Target calculation: 5650 + ( 5650 - 5300 ) = 6000
Crude oil: A zero-sum game?
“The current fall in price does nothing to offset the squeeze on the total economy from rising costs,” Grantham writes. “It merely transfers massive amounts of income from one subgroup (oil producers) to another (oil consumers), in a largely zero-sum game....”[Business Insider]
The above quote from Jeremy Grantham made me do a double-take. His "largely zero-sum game" refers to the global playing field. Oil producers such as the Saudis, Russia, Venezuela, Nigeria and Iran will earn less per barrel, while oil consumers like China and the EU will gain an equivalent amount per barrel. More importantly, oil consumers will receive a substantial boost to their economies. The "zero-sum game" assumes that crude production will remain constant. But consumption is likely to rise significantly as plunging oil prices deliver more disposable income to consumers, providing a massive stimulus to local economies. That in turn will lead to increased production of crude oil. A win-win for producers and consumers.
The Nymex Light Crude monthly chart shows a breach of long-term support at $75/barrel. Brent crude is in a similar down-trend. Target for the (WTI) decline is $40/barrel*.
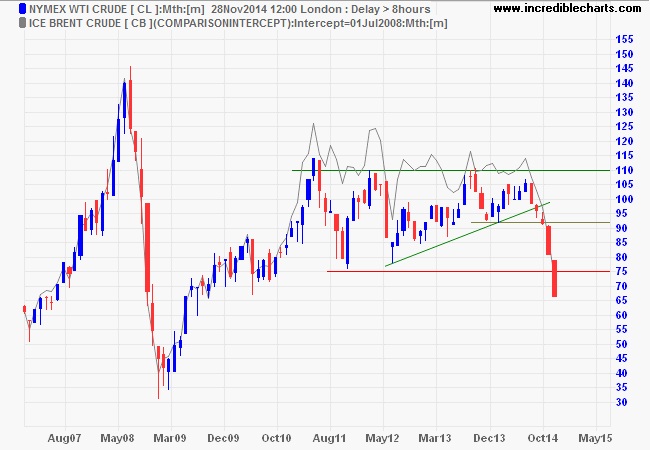
* Target calculation: 75 - ( 110 - 75 ) = 40
Plunging prices may slow the establishment of new wells, but existing wells are likely to continue pumping as long as the price per barrel of crude is higher than the marginal cost. Marginal costs ignore sunk (or fixed) costs like exploration and establishing a new well. They are merely the variable costs that would be saved — like wages and consumables — if production is halted. Marginal costs are far lower than the producers' total cost and are not yet threatened.
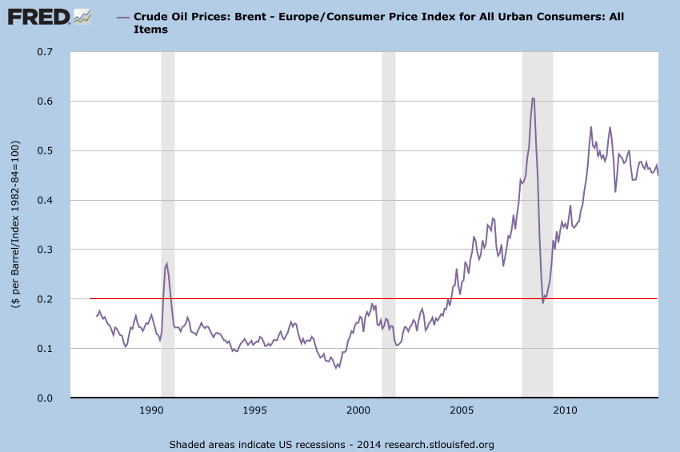
As for the long-term viability of producers at lower prices, the following chart is worth repeating. Prior to the 2005 "China boom", the ratio of crude prices to CPI oscillated between 0.1 and 0.2. Over the last few years it has soared to between 0.4 and 0.6. A fall back to 0.2 would harm new, marginal producers (i.e. US fracking) but should not affect core producers. Whether governments reliant on "oil-welfare" — like Russia, Iran and Venezuela — are sustainable is an entirely different matter.
Black Friday - pic.twitter.com/jdq7HY5h1k
— Jeff Lewis (@JeffALewis) November 28, 2014From my good friend Anton Bryant:
GEORGE BERNARD SHAW to Winston Churchill:
"I am enclosing two tickets to the first night of my new play;
bring a friend, if you have one."
CHURCHILL in response:
"Cannot possibly attend first night, will attend second .... if there is one."
Disclaimer
Research & Investment Pty Ltd is a Corporate Authorized Representative (AR Number 384 397) of Andika Pty Ltd which holds an Australian Financial Services Licence (AFSL 297069).
The information on this web site and in the newsletters is general in nature and does not consider your personal circumstances. Please contact your professional financial adviser for advice tailored to your needs.
Research & Investment Pty Ltd ("R&I") has made every effort to ensure the reliability of the views and recommendations expressed in the reports published on its websites and newsletters. Our research is based upon information known to us or which was obtained from sources which we believe to be reliable and accurate.
No guarantee as to the capital value of investments, nor future returns are made by R&I. Neither R&I nor its employees make any representation, warranty or guarantee that the information provided is complete, accurate, current or reliable.
You are under no obligation to use these services and should always compare financial services/products to find one which best meets your personal objectives, financial situation or needs.
To the extent permitted by law, R&I and its employees, agents and authorised representatives exclude all liability for any loss or damage (including indirect, special or consequential loss or damage) arising from the use of, or reliance on, any information. If the law prohibits the exclusion of such liability, such liability shall be limited, to the extent permitted by law, to the resupply of the said information or the cost of the said resupply.
Important Warning About Simulated Results
Research & Investment (R&I) specialise in developing, testing and researching investment strategies and systems. Within the R&I web site and newsletters, you will find information about investment strategies and their performance. It is important that you understand that results from R&I research are simulated and not actual results.
No representation is made that any investor will or is likely to achieve profits or losses similar to those shown.
Simulated performance results are generally prepared with the benefit of hindsight and do not involve financial risk. No modeling can completely account for the impact of financial risk in actual investment. Account size, brokerage and slippage may also diverge from simulated results. Numerous other factors related to the markets in general or to the implementation of any specific investment system cannot be fully accounted for in the preparation of simulated performance results and may adversely affect actual investment results.
To the extent permitted by law, R&I and its employees, agents and authorised representatives exclude all liability for any loss or damage (including indirect, special or consequential loss or damage) arising from the use of, or reliance on, any information offered by R&I whether or not caused by any negligent act or omission.

Author: Colin Twiggs is a former investment banker with almost 40 years of experience in financial markets. He co-founded Incredible Charts and writes the popular Trading Diary and Patient Investor newsletters.
Using a top-down approach, Colin identifies key macro trends in the global economy before evaluating selected opportunities using a combination of fundamental and technical analysis.
Focusing on interest rates and financial market liquidity as primary drivers of the economic cycle, he warned of the 2008/2009 and 2020 bear markets well ahead of actual events.
He founded PVT Capital (AFSL No. 546090) in May 2023, which offers investment strategy and advice to wholesale clients.
