Dollar and crude exert downward pressure on gold
By Colin Twiggs
November 26th, 2014 2:00 a.m. ET (6:00 p.m. AEDT)
Advice herein is provided for the general information of readers and does not have regard to any particular person's investment objectives, financial situation or needs. Accordingly, no reader should act on the basis of any information contained herein without first having consulted a suitably qualified financial advisor.
Ten-year Treasury Note yields retreated below 2.30%, signaling another test of primary support at 2.00%. Declining 13-week Twiggs Momentum below zero suggests a continuing down-trend. Recovery above 2.40% is unlikely, but would warn of a rally to 2.65%.
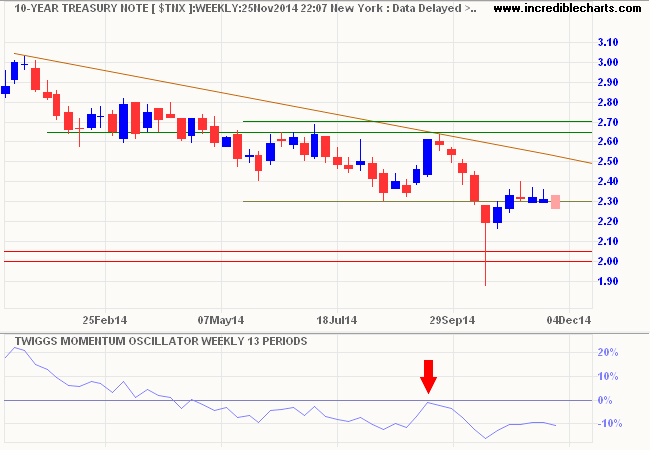
* Target calculation: 2.30 - ( 2.60 - 2.30 ) = 2.00
The Dollar Index is testing resistance at its 2008/2010 highs between 88 and 90. Rising 13-week Twiggs Momentum indicates a healthy (primary) up-trend. Expect retracement or consolidation below resistance, but failure of support at 84 is unlikely.
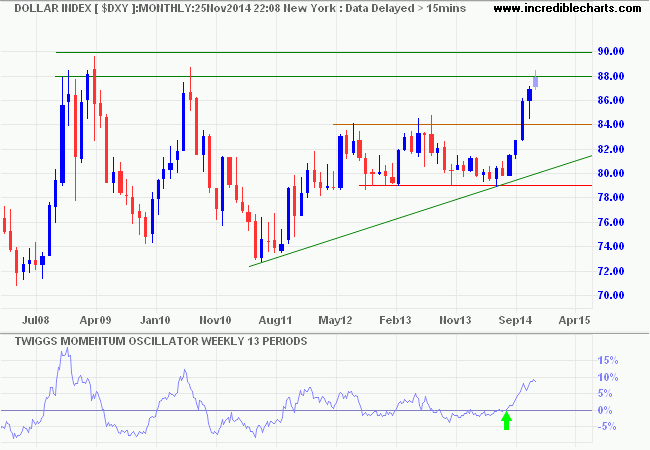
* Target calculation: 84 + ( 84 - 79 ) = 89.00
Gold
Low inflation and a strong dollar reduce demand for gold. Low interest rates reduce the carrying cost of gold, but the appeal is muted when inflation expectations remain low. Gold is testing its new resistance level at $1200/ounce. Respect is likely and would confirm a long-term target of $1000*. Declining 13-week Twiggs Momentum below zero indicates a strong down-trend.
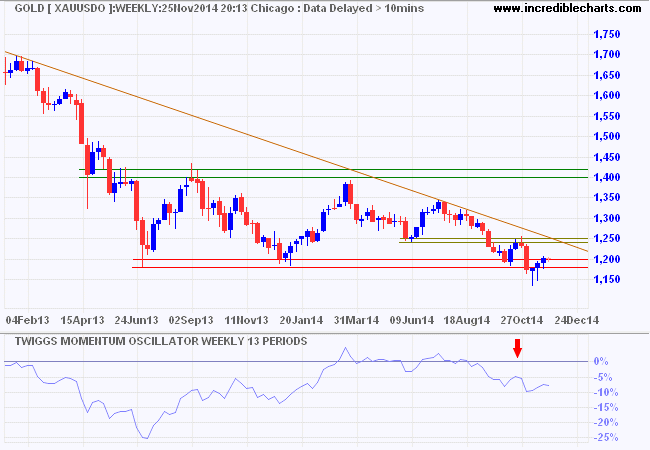
* Target calculation: 1200 - ( 1400 - 1200 ) = 1000
Crude Oil
Nymex Light Crude broke long-term support at $76/barrel, signaling a further decline. Sharply falling 13-week Twiggs Momentum reinforces this. Brent crude is in a similar down-trend. Long-term target for WTI is $50/barrel*.
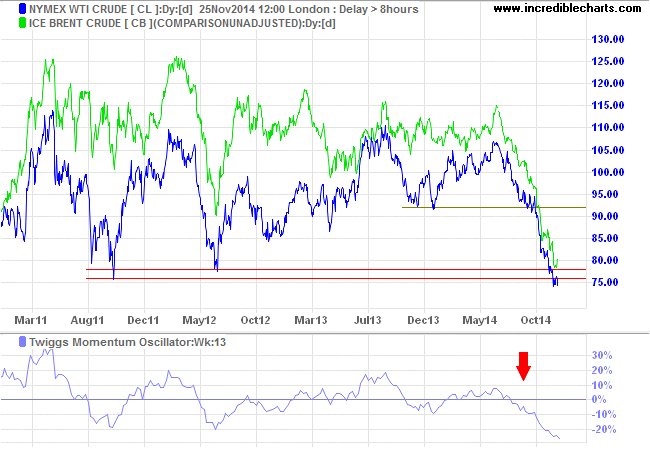
* Target calculation: 80 - ( 110 - 80 ) = 50
Supply is booming and OPEC members appear unwilling to agree on production cuts [Bloomberg]. Goldman Sachs project WTI prices of around $74/barrel in 2015 [Business Insider], but the following chart of real crude prices (Brent crude/CPI) suggests otherwise.
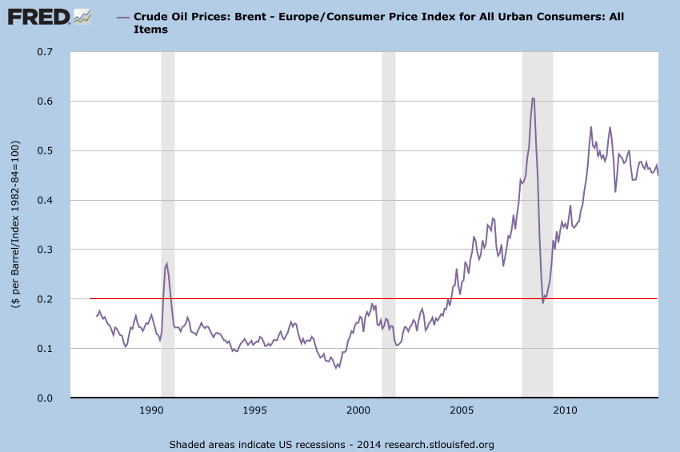
Prior to the 2005 "China boom", the index seldom ventured above 0.2. The subsequent surge in real crude prices produced two unwelcome results. First, higher prices retarded recovery from the 2008/2009 recession, acting as a hand-brake on global growth. The second unpleasant consequence is a restored Russian war chest, financing Vladimir Putin's geo-political ambitions.
I suspect that crude prices are not going to reach the 2008 low of close to $30/barrel, but the technical target of $50* is within reach. Given the propensity of gold and crude prices to impact on each other, the bearish effect on gold could be immense.
They say there are two sides to everything. But there is only one side to the stock market; and it is not the bull side or the bear side, but the right side. It took me longer to get that general principle fixed firmly in my mind than it did most of the more technical phases of the game of stock speculation.
~ Jesse Livermore
Disclaimer
Research & Investment Pty Ltd is a Corporate Authorized Representative (AR Number 384 397) of Andika Pty Ltd which holds an Australian Financial Services Licence (AFSL 297069).
The information on this web site and in the newsletters is general in nature and does not consider your personal circumstances. Please contact your professional financial adviser for advice tailored to your needs.
Research & Investment Pty Ltd ("R&I") has made every effort to ensure the reliability of the views and recommendations expressed in the reports published on its websites and newsletters. Our research is based upon information known to us or which was obtained from sources which we believe to be reliable and accurate.
No guarantee as to the capital value of investments, nor future returns are made by R&I. Neither R&I nor its employees make any representation, warranty or guarantee that the information provided is complete, accurate, current or reliable.
You are under no obligation to use these services and should always compare financial services/products to find one which best meets your personal objectives, financial situation or needs.
To the extent permitted by law, R&I and its employees, agents and authorised representatives exclude all liability for any loss or damage (including indirect, special or consequential loss or damage) arising from the use of, or reliance on, any information. If the law prohibits the exclusion of such liability, such liability shall be limited, to the extent permitted by law, to the resupply of the said information or the cost of the said resupply.
Important Warning About Simulated Results
Research & Investment (R&I) specialise in developing, testing and researching investment strategies and systems. Within the R&I web site and newsletters, you will find information about investment strategies and their performance. It is important that you understand that results from R&I research are simulated and not actual results.
No representation is made that any investor will or is likely to achieve profits or losses similar to those shown.
Simulated performance results are generally prepared with the benefit of hindsight and do not involve financial risk. No modeling can completely account for the impact of financial risk in actual investment. Account size, brokerage and slippage may also diverge from simulated results. Numerous other factors related to the markets in general or to the implementation of any specific investment system cannot be fully accounted for in the preparation of simulated performance results and may adversely affect actual investment results.
To the extent permitted by law, R&I and its employees, agents and authorised representatives exclude all liability for any loss or damage (including indirect, special or consequential loss or damage) arising from the use of, or reliance on, any information offered by R&I whether or not caused by any negligent act or omission.

Author: Colin Twiggs is a former investment banker with almost 40 years of experience in financial markets. He co-founded Incredible Charts and writes the popular Trading Diary and Patient Investor newsletters.
Using a top-down approach, Colin identifies key macro trends in the global economy before evaluating selected opportunities using a combination of fundamental and technical analysis.
Focusing on interest rates and financial market liquidity as primary drivers of the economic cycle, he warned of the 2008/2009 and 2020 bear markets well ahead of actual events.
He founded PVT Capital (AFSL No. 546090) in May 2023, which offers investment strategy and advice to wholesale clients.
