Will the stock market collapse when QE is withdrawn?
By Colin Twiggs
November 12th, 2014 2:00 p.m. ET (6:00 a:m AEDT)
Advice herein is provided for the general information of readers and does not have regard to any particular person's investment objectives, financial situation or needs. Accordingly, no reader should act on the basis of any information contained herein without first having consulted a suitably qualified financial advisor.
Changes to our Privacy Policy
Apologies for the frequent revision of our Privacy Policy (the last change was March 27th, 2014), but I need to accommodate an advertising request from the ASX:
We use information collected in the following ways...To send no more than one direct e-mail from third-party advertisers to newsletter mailing list subscribers percalendar monthfortnight. No email addresses and personal details are provided to advertisers.
Will withdrawal of Quantitative Easing cause a stock market collapse?
This chart in Westpac's Northern Exposure chart summary implies that US stocks rely on Fed balance sheet expansion (QE) for support.
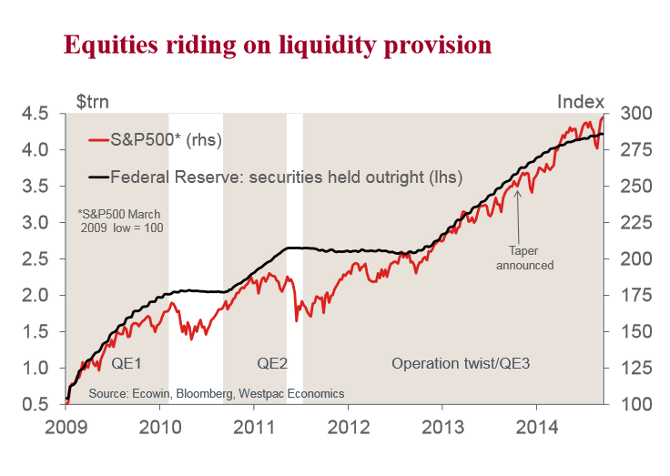
The curve shows an almost perfect fit. There are just two things wrong with it. First, the scales on the left and right sides of the chart are not proportionate: the scale on the left compares a 9 times increase to a 3 times increase on the right. Second, while the Fed has expanded its balance sheet to more than $4 Trillion, a large percentage of that money has washed straight back to the Fed — deposited by banks as excess reserves.
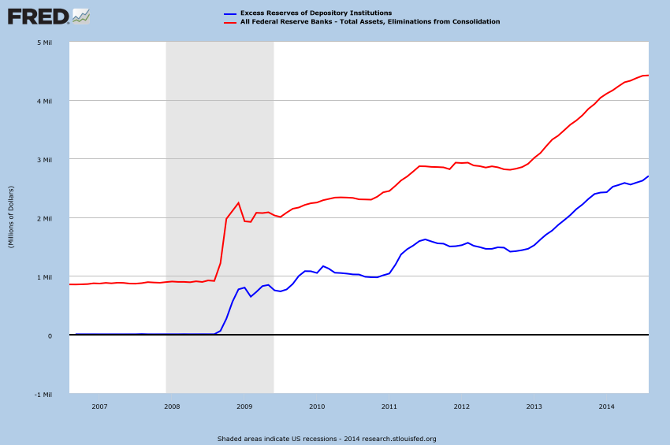
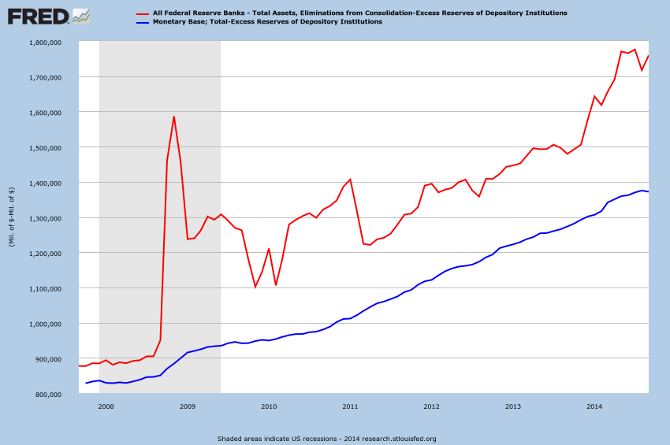
The impact on the working monetary base (monetary base adjusted for excess reserves) is far smaller: a rise of 66% (or $544 billion) over the past 7 years.
A chart since 1985 shows nominal GDP (GDP before adjustment for inflation) normally expanded between 5% and 7.5% a year outside of recessions. But NGDP has not recovered above 5% after 2008. This may be partly attributable to lower inflation, but the Fed would clearly want to see NGDP above 5% — roughly 3% real growth and 2% inflation.
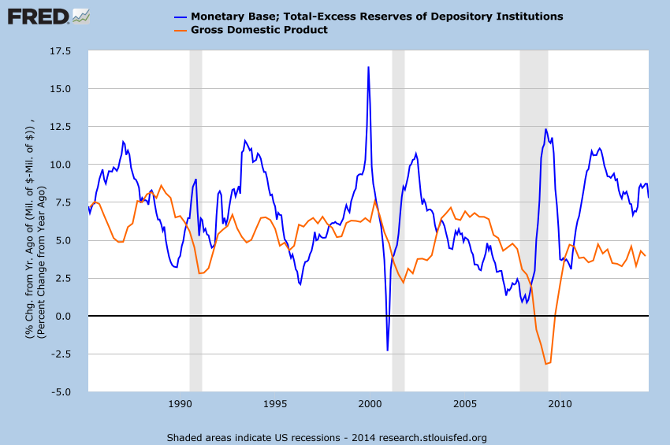
We can also see that growth of below 5% in the working monetary base is often precursor to a recession, 1995/1996 being one exception. The second is when the Fed took their foot off the gas pedal too early, after QE1 in 2010, but were able to resume in time to head off a major contraction. They have been far more circumspect the second time and are likely to maintain monetary base growth North of 5%. Too sharp a slow-down would be cause for concern.
When we calculate the ratio of total US stock market capitalisation to the working monetary base [blue line] it is apparent that market response to the increase in monetary base is far more cautious than it was in 1998/1999.
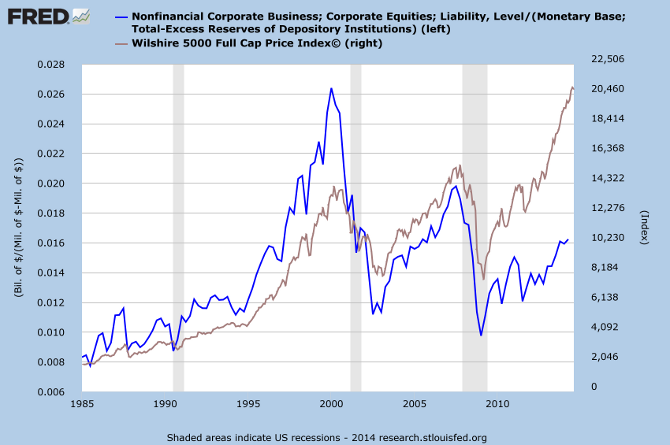
With Forward Price to Earnings Ratios for the S&P 500 and Nasdaq close to their long-term average (Westpac Northern Exposure, Page 118), I consider the likelihood of the QE taper precipitating a major market collapse to be remote.
More....
Our stay-put behavior reflects our view that the stock market serves as a relocation center at which money is moved from the active to the patient.
~ Warren Buffett
Disclaimer
Research & Investment Pty Ltd is a Corporate Authorized Representative (AR Number 384 397) of Andika Pty Ltd which holds an Australian Financial Services Licence (AFSL 297069).
The information on this web site and in the newsletters is general in nature and does not consider your personal circumstances. Please contact your professional financial adviser for advice tailored to your needs.
Research & Investment Pty Ltd ("R&I") has made every effort to ensure the reliability of the views and recommendations expressed in the reports published on its websites and newsletters. Our research is based upon information known to us or which was obtained from sources which we believe to be reliable and accurate.
No guarantee as to the capital value of investments, nor future returns are made by R&I. Neither R&I nor its employees make any representation, warranty or guarantee that the information provided is complete, accurate, current or reliable.
You are under no obligation to use these services and should always compare financial services/products to find one which best meets your personal objectives, financial situation or needs.
To the extent permitted by law, R&I and its employees, agents and authorised representatives exclude all liability for any loss or damage (including indirect, special or consequential loss or damage) arising from the use of, or reliance on, any information. If the law prohibits the exclusion of such liability, such liability shall be limited, to the extent permitted by law, to the resupply of the said information or the cost of the said resupply.
Important Warning About Simulated Results
Research & Investment (R&I) specialise in developing, testing and researching investment strategies and systems. Within the R&I web site and newsletters, you will find information about investment strategies and their performance. It is important that you understand that results from R&I research are simulated and not actual results.
No representation is made that any investor will or is likely to achieve profits or losses similar to those shown.
Simulated performance results are generally prepared with the benefit of hindsight and do not involve financial risk. No modeling can completely account for the impact of financial risk in actual investment. Account size, brokerage and slippage may also diverge from simulated results. Numerous other factors related to the markets in general or to the implementation of any specific investment system cannot be fully accounted for in the preparation of simulated performance results and may adversely affect actual investment results.
To the extent permitted by law, R&I and its employees, agents and authorised representatives exclude all liability for any loss or damage (including indirect, special or consequential loss or damage) arising from the use of, or reliance on, any information offered by R&I whether or not caused by any negligent act or omission.

Author: Colin Twiggs is a former investment banker with almost 40 years of experience in financial markets. He co-founded Incredible Charts and writes the popular Trading Diary and Patient Investor newsletters.
Using a top-down approach, Colin identifies key macro trends in the global economy before evaluating selected opportunities using a combination of fundamental and technical analysis.
Focusing on interest rates and financial market liquidity as primary drivers of the economic cycle, he warned of the 2008/2009 and 2020 bear markets well ahead of actual events.
He founded PVT Capital (AFSL No. 546090) in May 2023, which offers investment strategy and advice to wholesale clients.
