US job growth rebounds
By Colin Twiggs
October 4th, 2014 6:00 p.m. AEST (4:00 a:m EDT)
Advice herein is provided for the general information of readers and does not have regard to any particular person's investment objectives, financial situation or needs. Accordingly, no reader should act on the basis of any information contained herein without first having consulted a suitably qualified financial advisor.
Weekly highlights:
- US job growth rebounds, halting the correction
- Gold and crude oil are falling
- European stocks remain bearish
- Asian stocks are bearish
- US stocks continue to indicate a bull market
We are at the September quarter-end and stock weakness is likely to continue into October.
From the Wall Street Journal:
U.S. job growth rebounded in September and the jobless rate fell below 6% for the first time since mid-2008, suggesting the labor market is improving faster than previously thought. Nonfarm payrolls grew a seasonally adjusted 248,000 last month, the fastest pace since June, the Labor Department said Friday.
The S&P 500 broke downwards from its broadening wedge formation this week, warning of a correction to 1900. But Thursday's long tail and Friday's rally indicate buying support below 1950. Another test of 2000 is likely. Respect of resistance would warn of further weakness in October, while breakout would suggest a fresh advance; follow-through above 2020 would confirm.
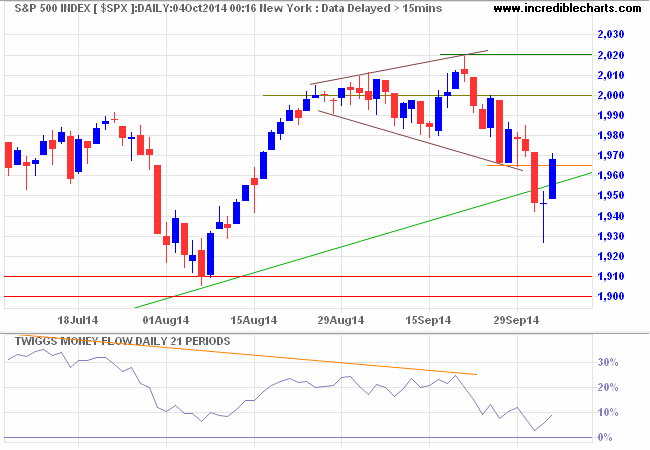
* Target calculation: 2000 + ( 2000 - 1900 ) = 2100
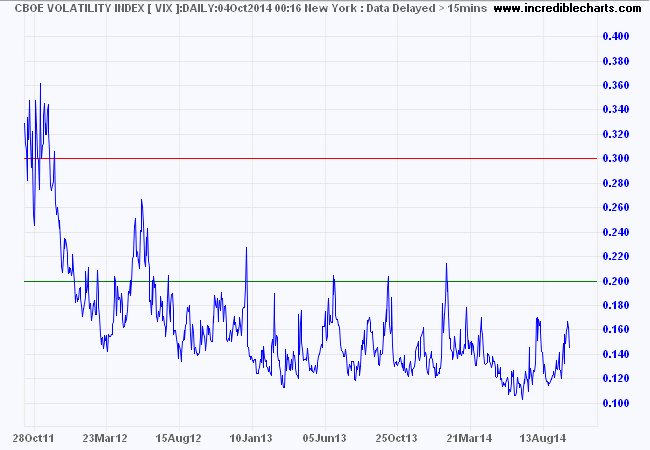
CBOE Volatility Index (VIX) remains below 20, typical of a bull market.
Dow Jones Euro Stoxx 50 found support at 3100, but this is unlikely to hold. Expect another test of primary support at 3000. Breach would signal a down-trend. Fall of 13-week Twiggs Money Flow below zero would strengthen the bear signal.
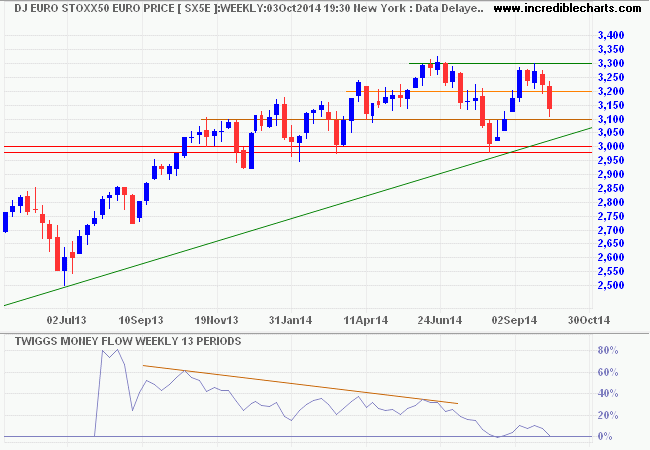
* Target calculation: 3000 - ( 3300 - 3000 ) = 2700
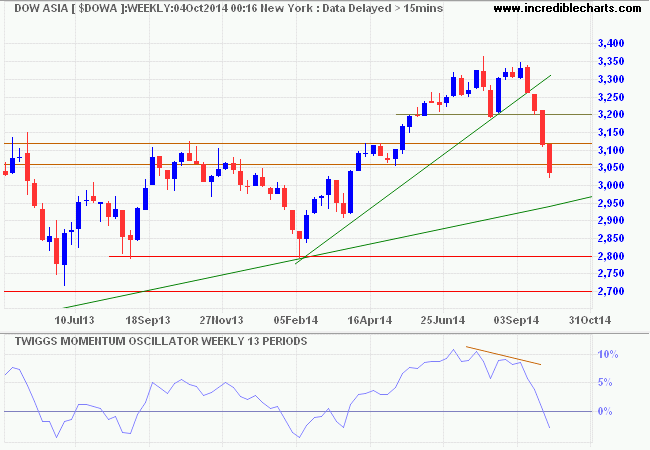
Dow Jones Asia Index is headed for a test of 2800 on the weekly chart despite continued bullishness on the Shanghai Composite, reflecting strength in the US Dollar. Penetration of the rising trendline would strengthen the bear signal. Reversal of 13-week Twiggs Momentum below zero also signals a primary down-trend.
The ASX 200 found support at 5250. Recovery above 5350 and the descending trendline would suggest that the correction is over. But respect of resistance remains as likely and breach of 5250 would warn of a test of 5000/5050. Recovery of 21-day Twiggs Money Flow above zero would indicate short-term buying pressure.
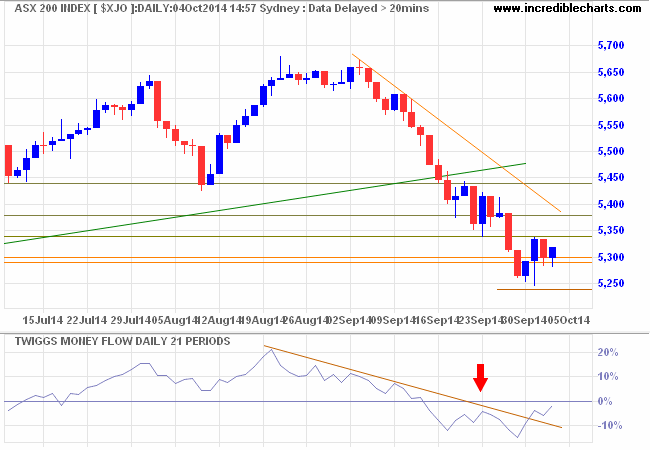
* Target calculation: 5650 + ( 5650 - 5350 ) = 5950
Gold breaks support
Spot gold broke support at $1200/ounce, warning of a primary down-trend to test $1000*. Follow-through below $1180 would confirm. 13-Week Twiggs Momentum below zero already signals a primary down-trend.
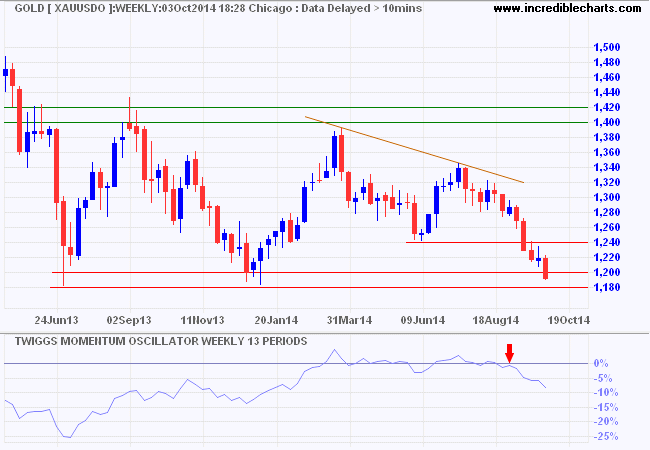
* Target calculation: 1200 - ( 1400 - 1200 ) = 1000
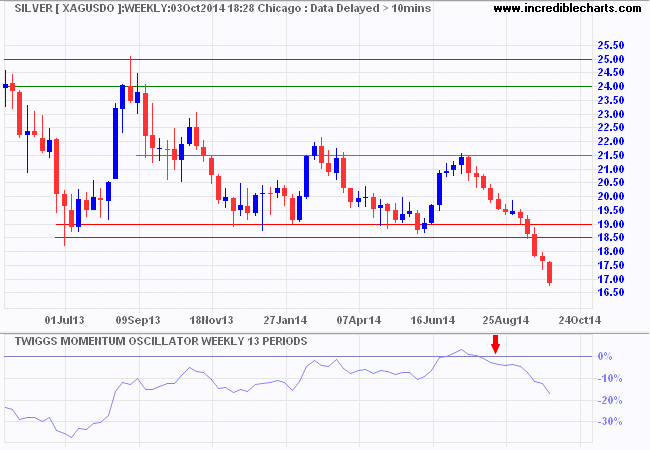
Spot silver has already broken primary support and gold is expected to follow.
Market turbulence
The quarter-end sell off may depress stock prices for a few more weeks, but it is important to stay in the market if you are investing with a long time horizon. Inexperienced investors tend to sell at the wrong time and buy at the wrong time — buy high and sell low — whereas more experienced hands will treat secondary weakness as a buying opportunity.
That's all from me for today. Take care.
It is a general rule of human nature that people despise those who treat them well, and look up to those who make no concessions.
~ Thucydides: History of the Peloponnesian War (460 - 395 B.C.)
Disclaimer
Research & Investment Pty Ltd is a Corporate Authorized Representative (AR Number 384 397) of Andika Pty Ltd which holds an Australian Financial Services Licence (AFSL 297069).
The information on this web site and in the newsletters is general in nature and does not consider your personal circumstances. Please contact your professional financial adviser for advice tailored to your needs.
Research & Investment Pty Ltd ("R&I") has made every effort to ensure the reliability of the views and recommendations expressed in the reports published on its websites and newsletters. Our research is based upon information known to us or which was obtained from sources which we believe to be reliable and accurate.
No guarantee as to the capital value of investments, nor future returns are made by R&I. Neither R&I nor its employees make any representation, warranty or guarantee that the information provided is complete, accurate, current or reliable.
You are under no obligation to use these services and should always compare financial services/products to find one which best meets your personal objectives, financial situation or needs.
To the extent permitted by law, R&I and its employees, agents and authorised representatives exclude all liability for any loss or damage (including indirect, special or consequential loss or damage) arising from the use of, or reliance on, any information. If the law prohibits the exclusion of such liability, such liability shall be limited, to the extent permitted by law, to the resupply of the said information or the cost of the said resupply.
Important Warning About Simulated Results
Research & Investment (R&I) specialise in developing, testing and researching investment strategies and systems. Within the R&I web site and newsletters, you will find information about investment strategies and their performance. It is important that you understand that results from R&I research are simulated and not actual results.
No representation is made that any investor will or is likely to achieve profits or losses similar to those shown.
Simulated performance results are generally prepared with the benefit of hindsight and do not involve financial risk. No modeling can completely account for the impact of financial risk in actual investment. Account size, brokerage and slippage may also diverge from simulated results. Numerous other factors related to the markets in general or to the implementation of any specific investment system cannot be fully accounted for in the preparation of simulated performance results and may adversely affect actual investment results.
To the extent permitted by law, R&I and its employees, agents and authorised representatives exclude all liability for any loss or damage (including indirect, special or consequential loss or damage) arising from the use of, or reliance on, any information offered by R&I whether or not caused by any negligent act or omission.

Author: Colin Twiggs is a former investment banker with almost 40 years of experience in financial markets. He co-founded Incredible Charts and writes the popular Trading Diary and Patient Investor newsletters.
Using a top-down approach, Colin identifies key macro trends in the global economy before evaluating selected opportunities using a combination of fundamental and technical analysis.
Focusing on interest rates and financial market liquidity as primary drivers of the economic cycle, he warned of the 2008/2009 and 2020 bear markets well ahead of actual events.
He founded PVT Capital (AFSL No. 546090) in May 2023, which offers investment strategy and advice to wholesale clients.
