S&P 500 broadening wedge
By Colin Twiggs
September 27th, 2014 7:00 p.m. AEST (5:00 a:m EDT)
Advice herein is provided for the general information of readers and does not have regard to any particular person's investment objectives, financial situation or needs. Accordingly, no reader should act on the basis of any information contained herein without first having consulted a suitably qualified financial advisor.
Performance
ASX200 Prime Momentum strategy returned +22.64%* for the 12 months ended 31st August 2014 compared to +14.41% for the benchmark ASX200 Accumulation Index.
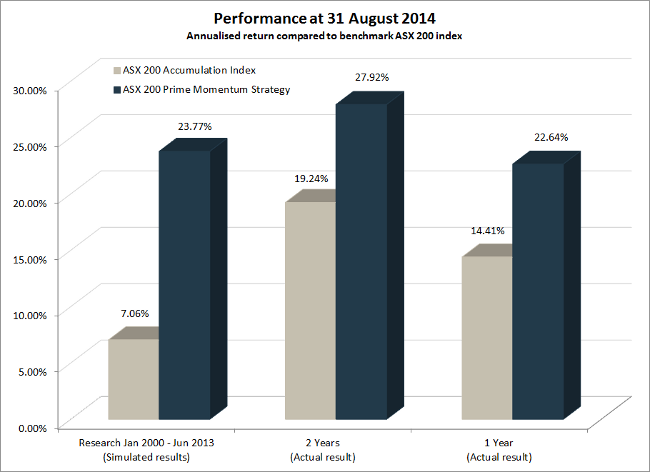
The S&P 500 Prime Momentum strategy had a good month, gaining 5.98% in August. The strategy has been running live for ten months, since November 2013, and returned 15.46%* for the period, compared to 15.96% for the S&P 500 Total Return Index. A sell-off of momentum stocks affected performance since April, but macroeconomic and volatility filters indicate low risk typical of a bull market and we maintain full exposure to equities.
* Results are unaudited and subject to revision.
Weekly highlights:
- The Dollar is rising
- Gold and crude oil are falling
- European stocks remain bearish
- Asian stocks are bearish despite China showing strength
- US stocks reflect a bull market
We are at the September quarter-end and can expect stock weakness to continue into October.
Stock markets
Dow Jones Europe Index is testing primary support at 320. Breach would signal a down-trend. Follow-through below 315 would confirm. Penetration of the rising trendline and 13-week Twiggs Momentum peak below zero both strengthen the bear signal.
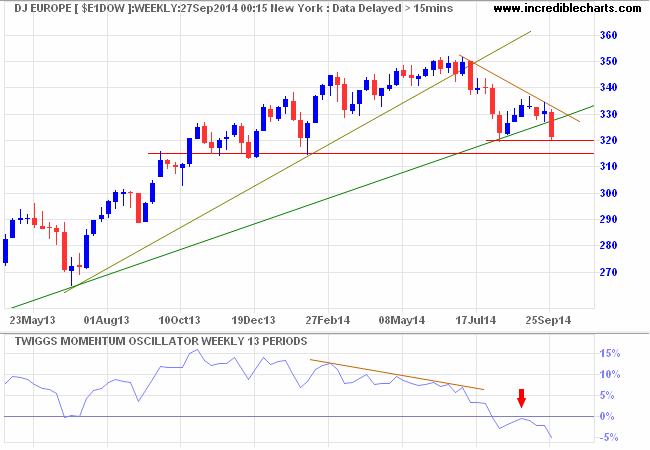
* Target calculation: 320 - ( 340 - 320 ) = 300
Dow Jones Asia Index broke primary support at 3200 despite bullishness on the Hang Seng and Shanghai Composite. Expect a test of support at 3000 (at the rising trendline). Reversal of 13-week Twiggs Momentum below zero would further strengthen the bear signal. Follow-through below 3000 would confirm a primary down-trend.
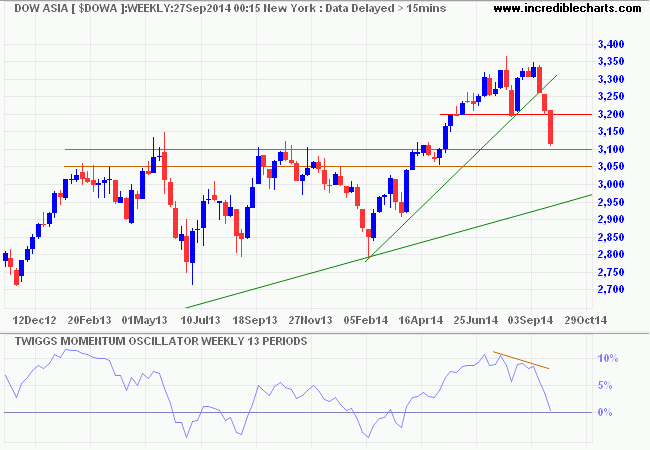
* Target calculation: 3100 + ( 3100 - 2800 ) = 3400
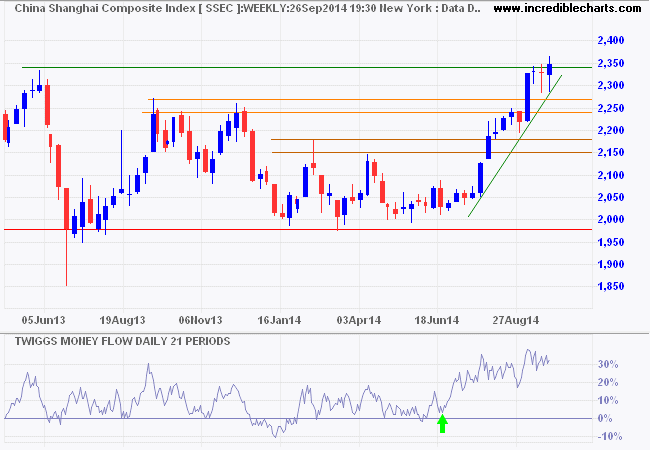
Shanghai Composite Index, however, continues to test resistance at 2350. Breakout would confirm a primary up-trend. Rising 13-week Twiggs Money Flow indicates medium-term buying pressure.
Bear in mind that Dow Asia and Dow Europe are priced in USD and reflect strength in the US Dollar as well as weakness in local markets — though the two are closely connected.
The S&P 500 is consolidating around the 2000 level in a broadening wedge formation. Do not be surprised if the index rallies early next week, to test medium-term resistance at 2020. Fund managers are normally willing to support the market at quarter-end and lock in quarterly performance bonuses. But this is likely to be followed by weakness in October as they sell off non-performing stocks and increase cash holdings until new opportunities present themselves. Breakout below the broadening wedge — and penetration of both support at 1950 and the (secondary) rising trendline — would warn of a correction. A large volume spike from triple-witching hour on September 19th, however, has exaggerated weakness on Twiggs Money Flow. Breakout above 2020 would signal a fresh advance.
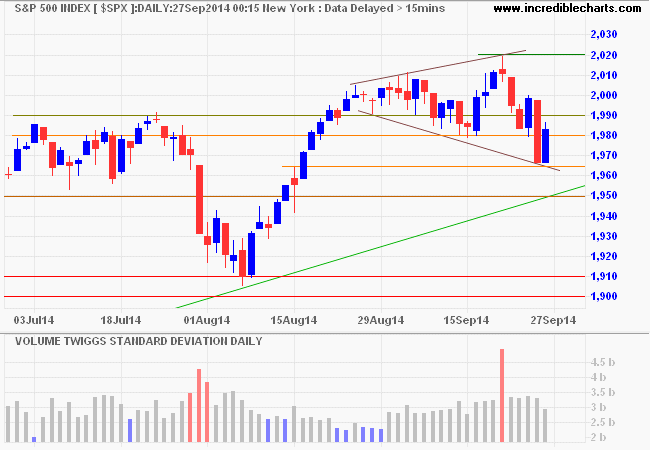
* Target calculation: 2000 + ( 2000 - 1900 ) = 2100
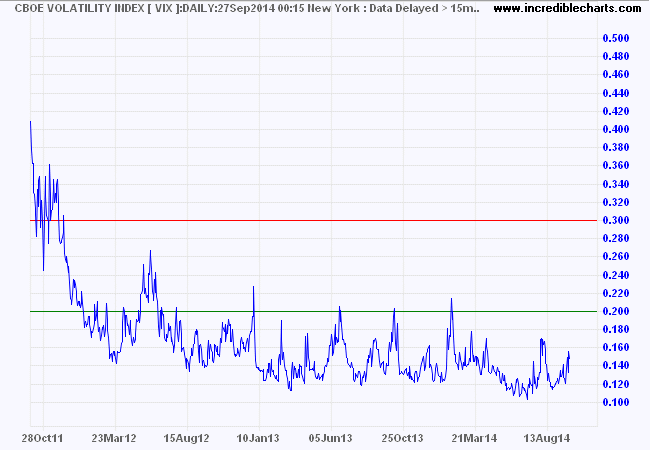
CBOE Volatility Index (VIX) remains in the low range (below 20) typical of a bull market.
The ASX 200 is testing support at 5300/5350. Penetration of the rising trendline warns of a correction to 5000. Declining 13-week Twiggs Money Flow, below zero, after a long-term bearish divergence, also signals weakness. Breach of 5300 would confirm a test of 5000. Recovery above 5550 is unlikely, but would suggest another test of 5650.
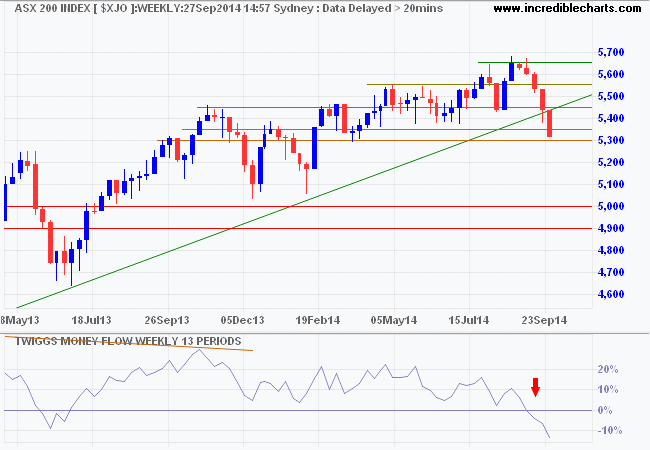
* Target calculation: 5650 + ( 5650 - 5350 ) = 5950
Trouble in the East
Expect a continued arm wrestle between Russia and the West over influence in the Ukraine. Russians obviously views their shrinking sphere of influence as a threat to their future security. But Vladimir Putin's actions in Georgia, Moldova, Crimea and the Ukraine — straight from the KGB playbook — are the biggest threat to their security.
A war-weary US and pacifist Europe may be slow to react, but their capacity when provoked to subdue any threat from the East, through their combined economic might, is immense. One should not be fooled by Putin's macho posturing. He is playing a very weak hand.
Market turbulence
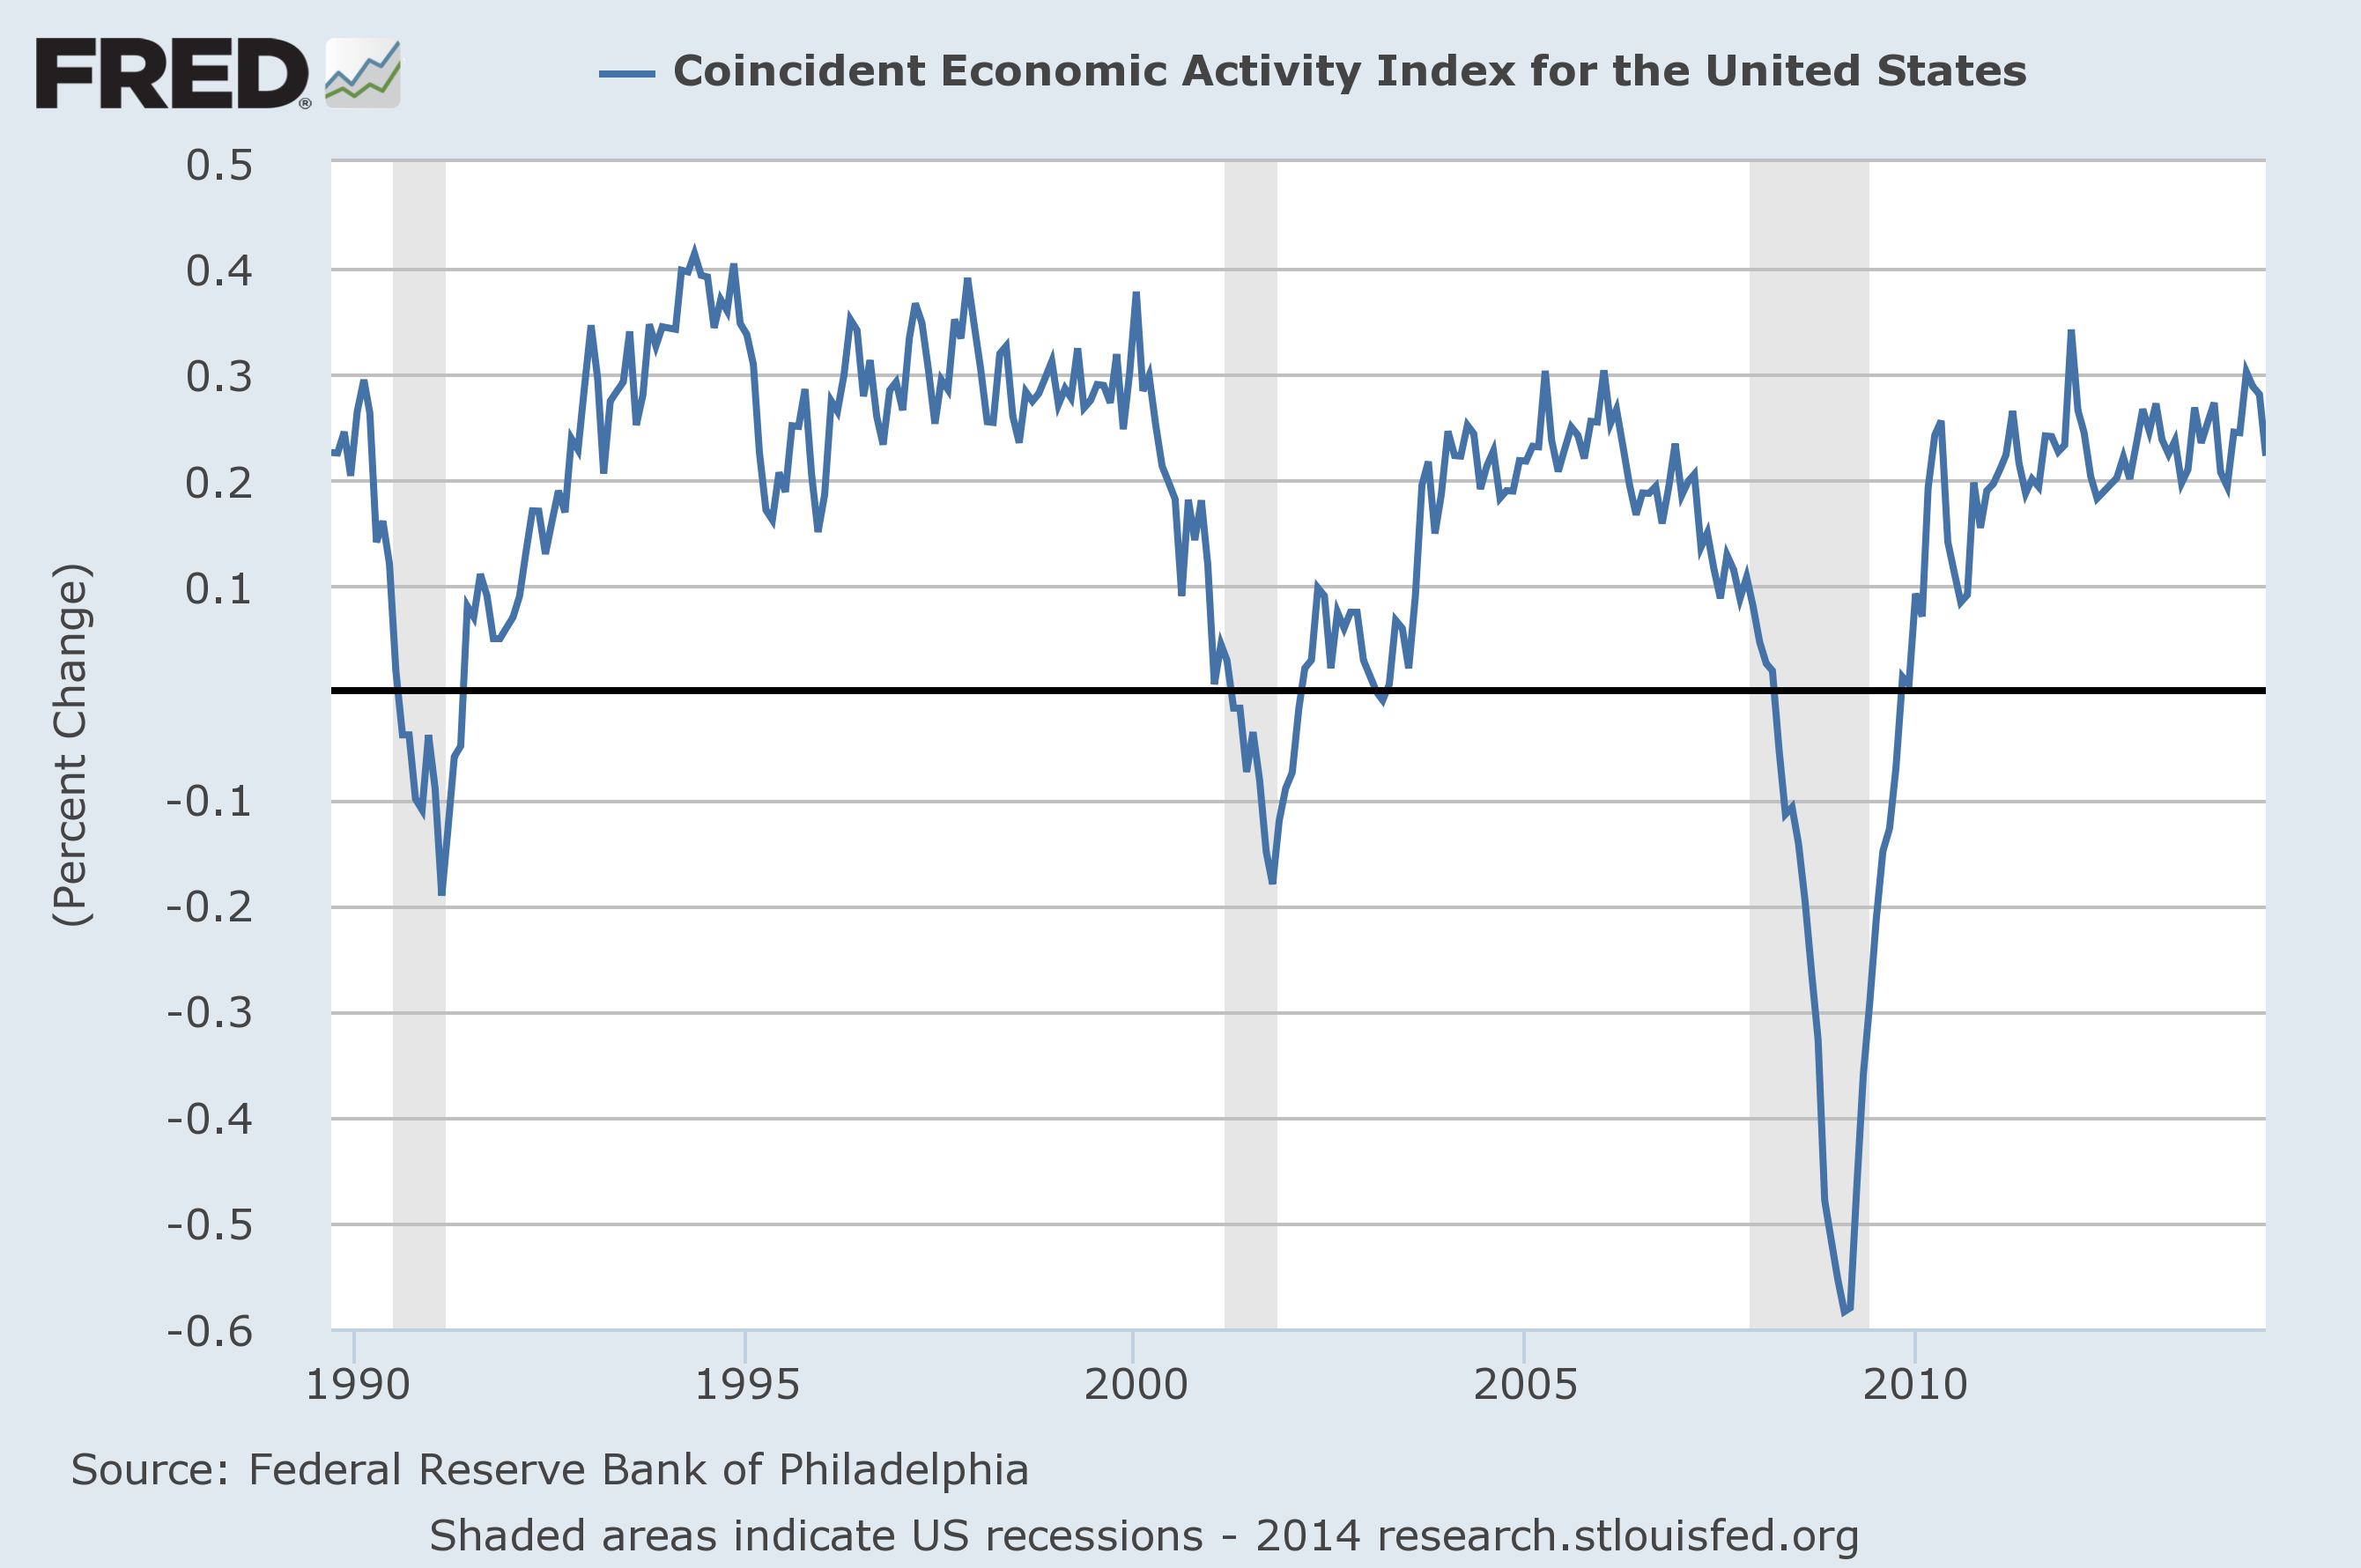
A Coincident Economic Activity Index above 0.2 indicates the US recovery is on track. Produced by the Philadelphia Fed, the index includes four indicators: nonfarm payroll employment, the unemployment rate, average hours worked in manufacturing, and wages and salaries. Bellwether stock Fedex also suggests rising economic activity.
But contraction of the ECB balance sheet by € 1 Trillion over the last two years has pitched Europe back into recession.
Chart: ECB (Eurosystem) balance sheet. The target is to raise it by EUR 1 trillion - pic.twitter.com/ptoqLkNpxq
— SoberLook.com (@SoberLook) September 27, 2014Weakness in Europe and Asia has the capacity to retard performance of US stocks despite the domestic recovery.
Australian investors
Australian stocks have taken a bit of a beating over the last few weeks, including a few of the momentum stocks in our portfolio. Risk of a bear market remains low, but a falling Aussie Dollar has prompted international investors to scale back exposure to Australian equities.
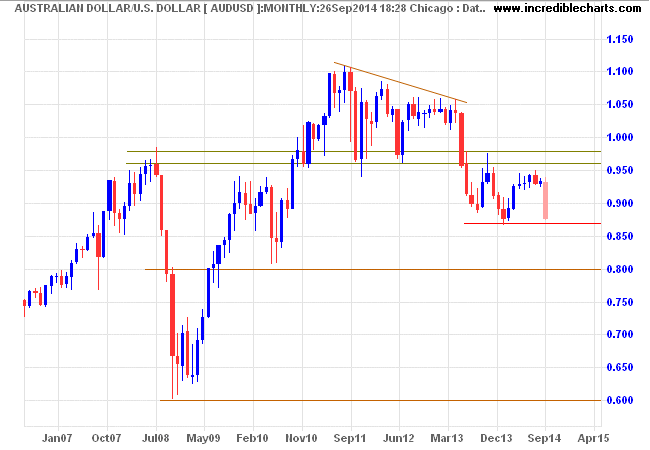
This tends to become self-reinforcing as falling stock prices then prompt further sell-offs. And repatriation causes further weakness in the Aussie Dollar. The down-trend is likely to continue if support at $0.8650/$0.8700 is breached.
Investors who split their portfolio between the S&P 500 and the ASX 200 have been cushioned from the fall, with their US portfolio showing strong appreciation in Australian Dollar terms.
That's all from me for today. Take care.
Peace is [merely] an armistice in a continuous war.
~ Thucydides: History of the Peloponnesian War (460 - 395 B.C.)
Disclaimer
Research & Investment Pty Ltd is a Corporate Authorized Representative (AR Number 384 397) of Andika Pty Ltd which holds an Australian Financial Services Licence (AFSL 297069).
The information on this web site and in the newsletters is general in nature and does not consider your personal circumstances. Please contact your professional financial adviser for advice tailored to your needs.
Research & Investment Pty Ltd ("R&I") has made every effort to ensure the reliability of the views and recommendations expressed in the reports published on its websites and newsletters. Our research is based upon information known to us or which was obtained from sources which we believe to be reliable and accurate.
No guarantee as to the capital value of investments, nor future returns are made by R&I. Neither R&I nor its employees make any representation, warranty or guarantee that the information provided is complete, accurate, current or reliable.
You are under no obligation to use these services and should always compare financial services/products to find one which best meets your personal objectives, financial situation or needs.
To the extent permitted by law, R&I and its employees, agents and authorised representatives exclude all liability for any loss or damage (including indirect, special or consequential loss or damage) arising from the use of, or reliance on, any information. If the law prohibits the exclusion of such liability, such liability shall be limited, to the extent permitted by law, to the resupply of the said information or the cost of the said resupply.
Important Warning About Simulated Results
Research & Investment (R&I) specialise in developing, testing and researching investment strategies and systems. Within the R&I web site and newsletters, you will find information about investment strategies and their performance. It is important that you understand that results from R&I research are simulated and not actual results.
No representation is made that any investor will or is likely to achieve profits or losses similar to those shown.
Simulated performance results are generally prepared with the benefit of hindsight and do not involve financial risk. No modeling can completely account for the impact of financial risk in actual investment. Account size, brokerage and slippage may also diverge from simulated results. Numerous other factors related to the markets in general or to the implementation of any specific investment system cannot be fully accounted for in the preparation of simulated performance results and may adversely affect actual investment results.
To the extent permitted by law, R&I and its employees, agents and authorised representatives exclude all liability for any loss or damage (including indirect, special or consequential loss or damage) arising from the use of, or reliance on, any information offered by R&I whether or not caused by any negligent act or omission.

Author: Colin Twiggs is a former investment banker with almost 40 years of experience in financial markets. He co-founded Incredible Charts and writes the popular Trading Diary and Patient Investor newsletters.
Using a top-down approach, Colin identifies key macro trends in the global economy before evaluating selected opportunities using a combination of fundamental and technical analysis.
Focusing on interest rates and financial market liquidity as primary drivers of the economic cycle, he warned of the 2008/2009 and 2020 bear markets well ahead of actual events.
He founded PVT Capital (AFSL No. 546090) in May 2023, which offers investment strategy and advice to wholesale clients.
