What's New: Changes to UK & Singapore Data/Incredible Charts 7.0
By Colin Twiggs
August 4th, 2014 3:00 a.m. EDT (5:00 p.m. AEDT)
Changes to UK & Singapore Data
We are consolidating our intra-day (delayed) data feeds with one existing data supplier. This necessitates some changes to the feeds currently offered. Most subscribers will not be affected by the changes, but if the changes do affect you, please contact Support to amend your subscription.
LSE prices will only be updated end-of-day (after 7:30 p.m.) from 1st September 2014, while Singapore and free BATS data will no longer be offered.
The following stock exchange feeds are unaffected:
- ASX
- NYSE
- NASDAQ
- OTCBB
- OTC Markets
- TSX and TSX Venture
- Forex & Precious Metals
- Dow Jones Indices
- CBOE (S&P) Indices
- CSI end-of-day World Indices
Incredible Charts 7.0
Your existing Incredible Charts application will update to Incredible Charts 7.0 in the next 24 hours. This has been in beta since June and been tested thoroughly by a number of subscribers. If you have any problems with the update or new features, please contact Support.
New Premium Indicators
- Heikin-Ashi Candlesticks
- Ichimoku Cloud
- MACD Histogram with Direction Color
- Pivot Points
- Volume Twiggs Standard Deviation
New Indicators
Indicators Improvements
- Multiple Moving Averages and Rainbow 3D Moving Averages now offer a choice of Moving Averages: Exponential, Simple, and Weighted.
- Indicator Smoothing now allows for up to three Moving Averages to be applied to an indicator.
- Also for up to four Overbought/Oversold lines to be applied to an indicator.
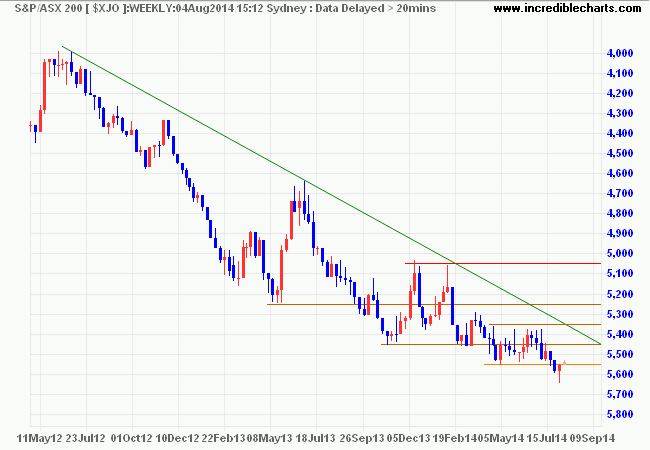
Invert Vertical Axes
- Invert the price axis using View >> Invert Vertical Axis. Shortcut key is CTRL+I.

Inverting the price axis on the ASX 200 provides a very different perspective of the current trend.
Indicator and Candlestick Values
- Indicator and candle values are now displayed in a hint on mouse-over.
- Activate or de-activate using the [i] button next to the Crosshair Cursor on the toolbar.
Trendlines – Percentage Change
- Percent Change is now displayed in a hint when you mouse-over the ends of a trendline. Percentage is calculated from start to end (left to right) of the trendline.
Loading Data from Disk
- Handles data formats more robustly when loading data from disk.
- Supports additional date formats YYYYMMDD and YYMMDD.
- Periodic disk data, for example weekly, monthly, quarterly and annual data, can now be loaded from disk.
Code Improvements
- Various changes based on feedback and error reports, mainly to accommodate Windows 8 issues.
Thank you for your patience and support.
Life is simpler when you plow around the stump.
~ old farmers proverb

Author: Colin Twiggs is a former investment banker with almost 40 years of experience in financial markets. He co-founded Incredible Charts and writes the popular Trading Diary and Patient Investor newsletters.
Using a top-down approach, Colin identifies key macro trends in the global economy before evaluating selected opportunities using a combination of fundamental and technical analysis.
Focusing on interest rates and financial market liquidity as primary drivers of the economic cycle, he warned of the 2008/2009 and 2020 bear markets well ahead of actual events.
He founded PVT Capital (AFSL No. 546090) in May 2023, which offers investment strategy and advice to wholesale clients.
