Europe leads markets lower
By Colin Twiggs
August 1st, 2014 9:30 a.m. AEST (7:30 p:m EDT)
Advice herein is provided for the general information of readers and does not have regard to any particular person's investment objectives, financial situation or needs. Accordingly, no reader should act on the basis of any information contained herein without first having consulted a suitably qualified financial advisor.
Research & Investment: Performance update
It's month-end again and the latest portfolio update will be released on Monday, after the ASX market close.
Performance of the ASX200 Momentum strategy looks to have once again out-stripped the ASX 200 Accumulation Index, but again we will only get the final figures on Monday — the second day of trading in the new month. The S&P 500 Momentum strategy may have been caught by the July 31st sell-off and we will have to wait for the final results.
Europe leads markets lower
Summary:
- Europe retreats as the Ukraine/Russia crisis escalates.
- S&P 500 displays milder selling pressure and the primary trend remains intact.
- VIX continues to indicate a bull market.
- China's Shanghai Composite is bullish in the medium-term.
- ASX 200 may experience a secondary correction, but the primary trend displays buying support.
European leaders are waking up to the seriousness of the menace posed by Russia in the East, summed up in a recent Der Spiegel editorial:
Europe, and we Germans, will certainly have to pay a price for sanctions. But the price would be incomparably greater were Putin allowed to continue to violate international law. Peace and security in Europe would then be in serious danger.
Vladimir Putin will not alter course because of a light slap on the wrist. President Obama is going to have to find Teddy Roosevelt's "big stick" — misplacement of which is largely responsible for Russia's current flagrant disregard of national borders. And Europe is going to have to endure real pain in order to face down the Russian threat in the East. Delivery of French Mistral warships, for example, would show that Europe remains divided and will encourage the Russian bear to take even bolder steps.
Russian Deputy Prime Minister Dmitry Rogozin said, however, that he doubted France would cancel the deal, despite coming under pressure from other Western leaders: "This is billions of euros. The French are very pragmatic. I doubt it [that the deal will be canceled]."
— The Moscow Times
The whole of Europe is likely to have to share the cost of cancelling deals like this, but it is important to do so and present a united front.
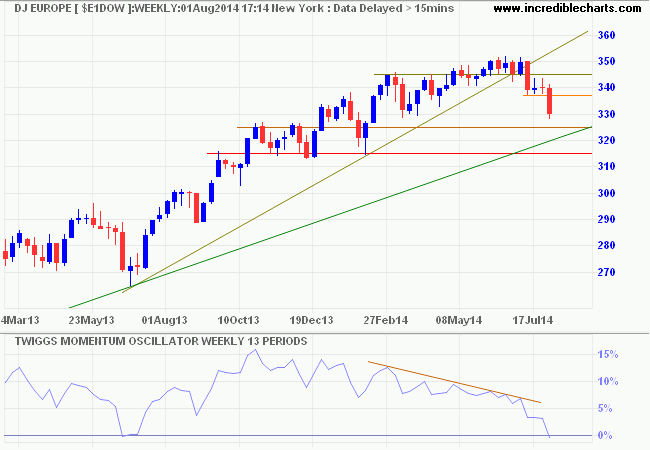
Markets reacted negatively to the latest escalation, with Dow Jones Europe Index falling almost 6% over the last month. 13-Week Twiggs Momentum dipped below zero after several months of bearish divergence, warning not necessarily of a primary down-trend, but of a serious test of primary support at 315. Respect of 325 and the rising trendline would reassure that the primary trend is intact.
The S&P 500 displays milder selling pressure on 13-week Twiggs Money Flow and the correction is likely to test the rising trendline and support at 1850/1900, but not primary support at 1750. Respect of the zero line by 13-week Twiggs Money Flow would signal a buying opportunity for long-term investors. Recovery above 2000 is unlikely at present, but breakout would offer a (long-term) target of 2250*.
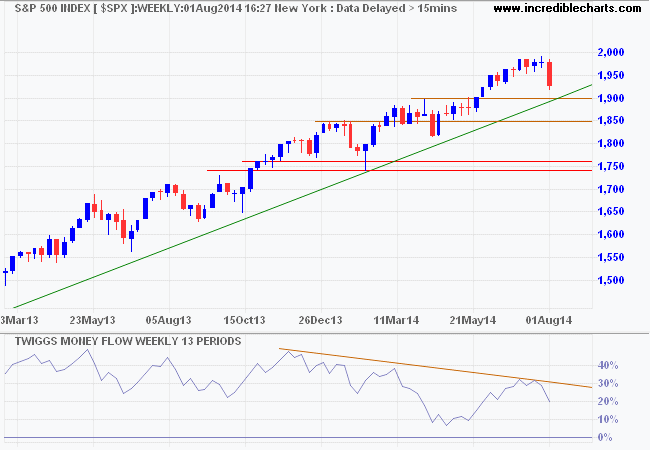
* Target calculation: 1500 + ( 1500 - 750 ) = 2250
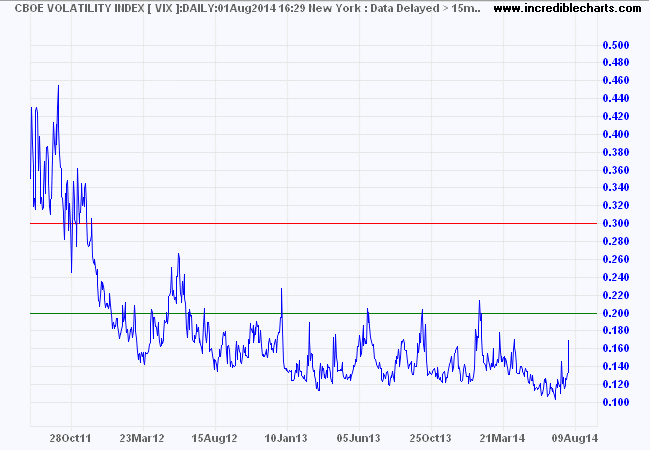
CBOE Volatility Index (VIX) spiked upwards, but remains low by historical standards and continues to suggest a bull market.
China's Shanghai Composite Index broke resistance at 2150, suggesting a primary up-trend, but I will wait for confirmation from a follow-through above 2250. Rising 13-week Twiggs Money Flow indicates medium-term buying pressure. Reversal below 2050 is unlikely at present but would warn of another test of primary support at 1990/2000. The PBOC is simply kicking the can down the road by injecting more liquidity into the banking system. That may defer the eventual day of reckoning by a year or two, but it cannot be avoided. And each time the problem is deferred, it grows bigger. So the medium-term outlook may be improving, but I still have doubts about the long-term.
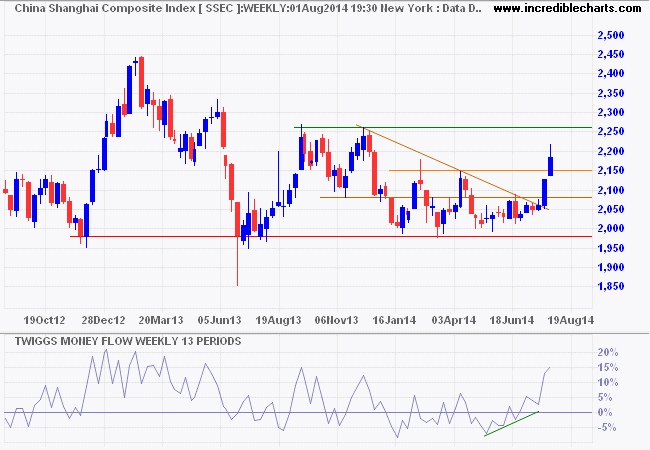
* Target calculation: 2000 - ( 2150 - 2000 ) = 1850
The ASX 200 is likely to retrace to test the rising trendline around 5450, but 13-week Twiggs Money Flow holding above zero continues to indicate buying support. Recovery above 5600 is unlikely at present, but would present a target of 5800*. Reversal below 5050 would signal a trend change, but that is most unlikely despite current bearishness.
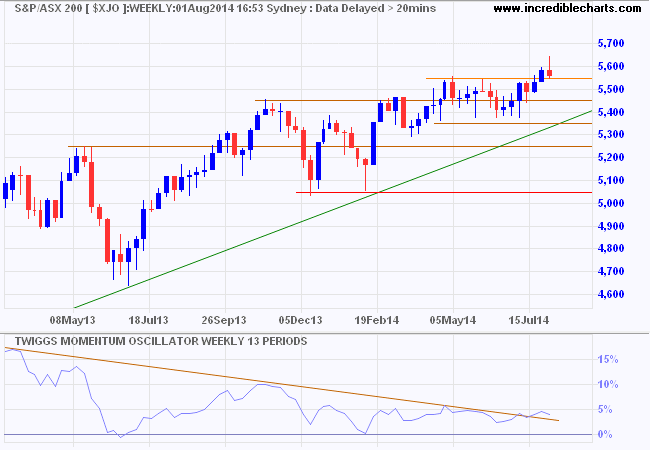
* Target calculation: 5400 + ( 5400 - 5000 ) = 5800
The following article was originally published in Musings on Markets and is reproduced with kind permission of the author, Aswath Damodaran. Aswath is a Professor of Finance at the Stern School of Business at NYU and teaches classes in corporate finance and valuation.
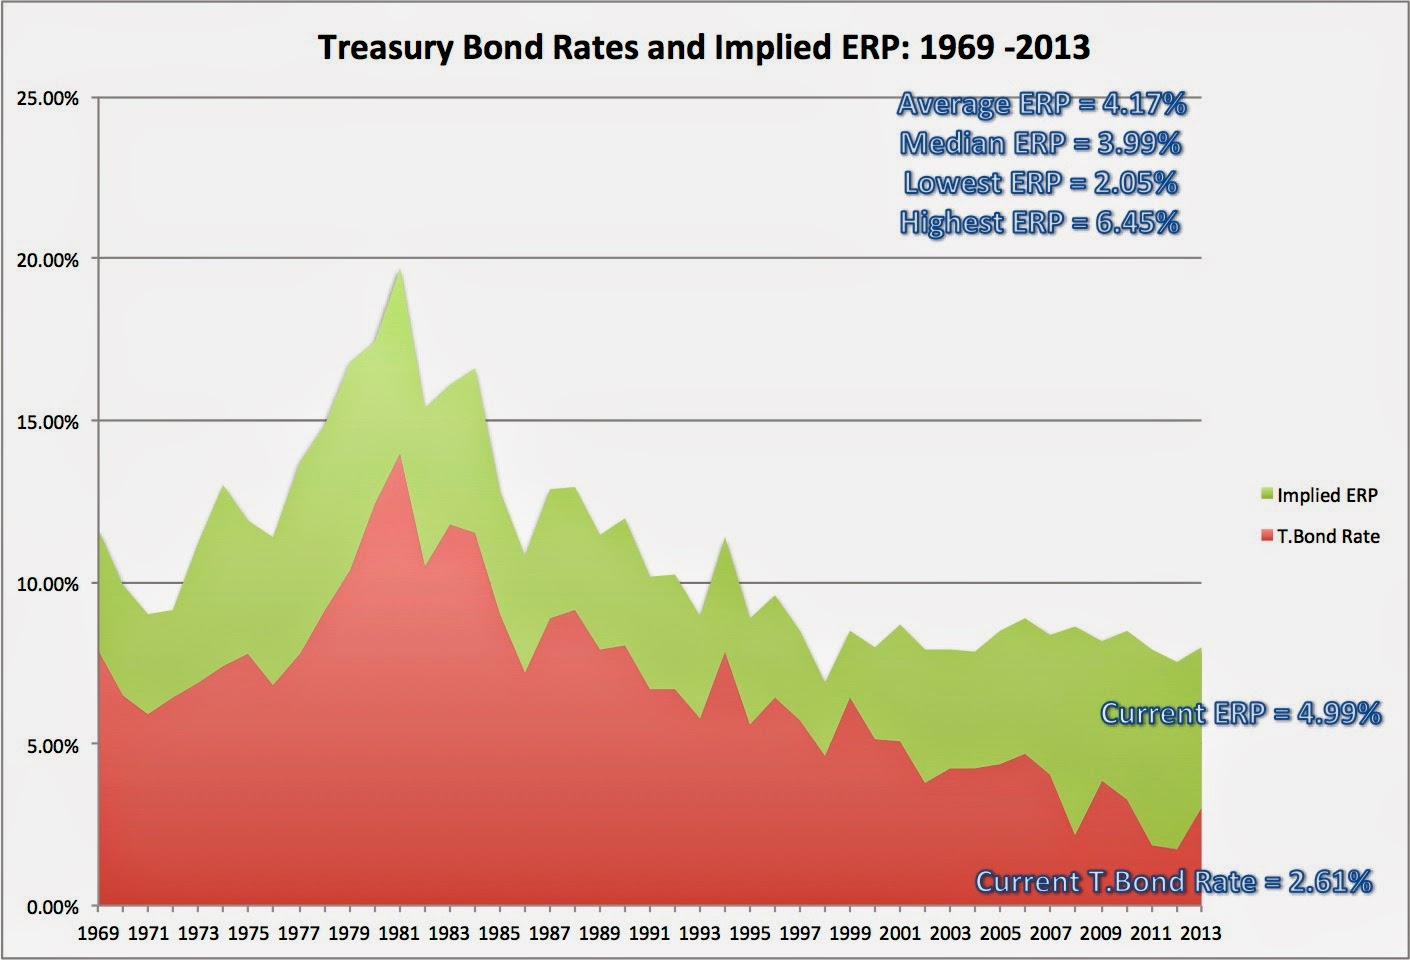
The essay is lengthy, but shows great insight into the current discussion on market valuation, analyzing the motives of various groups ("bubblers") who have been predicting the demise of the current bull market, and the relationship of Price-Earnings ratios (or its inverse, ERP) to long-term interest rates. His graph of Treasury Bond Rates and Implied ERP, particularly, demonstrates that current market valuations include a higher-than-normal risk premium. And his summation of the current state of affairs at the end is worth close attention.
Click on the images for a large view. I hope that you enjoy it.
Monday, June 16, 2014
Bubble, Bubble, Toil and Trouble: The Costs and Benefits of Market Timing
The Bubble Machine
- Doomsday Bubblers have been warning us that the stock market is in a bubble for as long as you have known them, and either want you to keep your entire portfolio in cash or in gold (or bitcoins). They remind me of this character from Winnie the Pooh and their theme seems to be that stocks are always over valued.
- Knee Jerk Bubblers go into hibernation in bear markets but become active as stocks start to rise and become increasingly agitated, the more they go up. They are the Bobblehead dolls of the bubble universe, convinced that if stocks have gone up a lot or for a long period, they are poised for a correction.
- Armchair Psychiatrist Bubblers use subtle or not-so-subtle psychological clues from their surroundings to make judgments about bubbles forming and bursting. Freudian in their thinking, they are convinced that any mention of stocks by shoeshine boys, cab drivers or mothers-in-law is a sure sign of a bubble.
- Conspiratorial Bubblers believe that bubbles are created by small group of evil people who plan to profit from them, with the Illuminati, hedge funds, Goldman Sachs and the Federal Reserve as prime suspects. Paranoid and ever-watchful, they are convinced that stocks are manipulated by larger and more powerful forces and that we are all helpless in the face of this darkness.
- Righteous Bubblers draw on a puritanical streak to argue that if investors are having too much fun (because stocks are going up), they have to be punished with a market crash. As the Flagellants in the bubble world, they whip themselves into a frenzy, especially during market booms.
- Rational Bubblers uses market metrics that are both intuitive and widely used, note their divergence from historical norms and argue for a correction back to the average. Viewing themselves as smarter than the rest of us and also as the voices of reason, they view their metrics as infallible and mean reversion in markets as immutable.
Detecting a Bubble
The benefits of being able to detect a bubble, when you are in in its midst rather than after it bursts, is that you may be able to protect yourself from its consequences. But are there any mechanisms that detect bubbles? And if they exist, how well do they work?
a. PE and variants
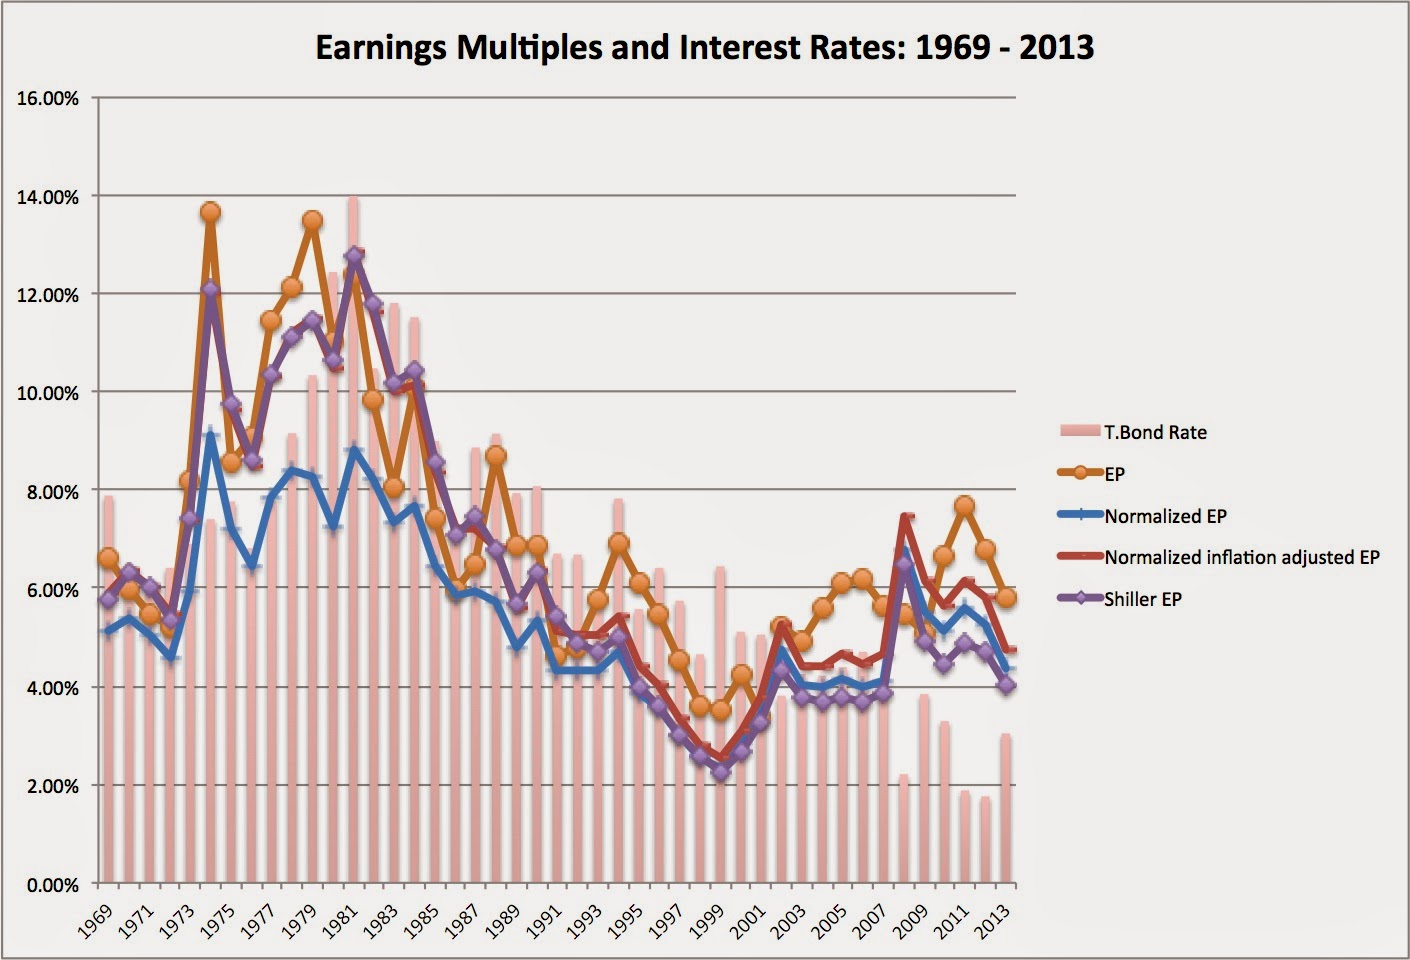
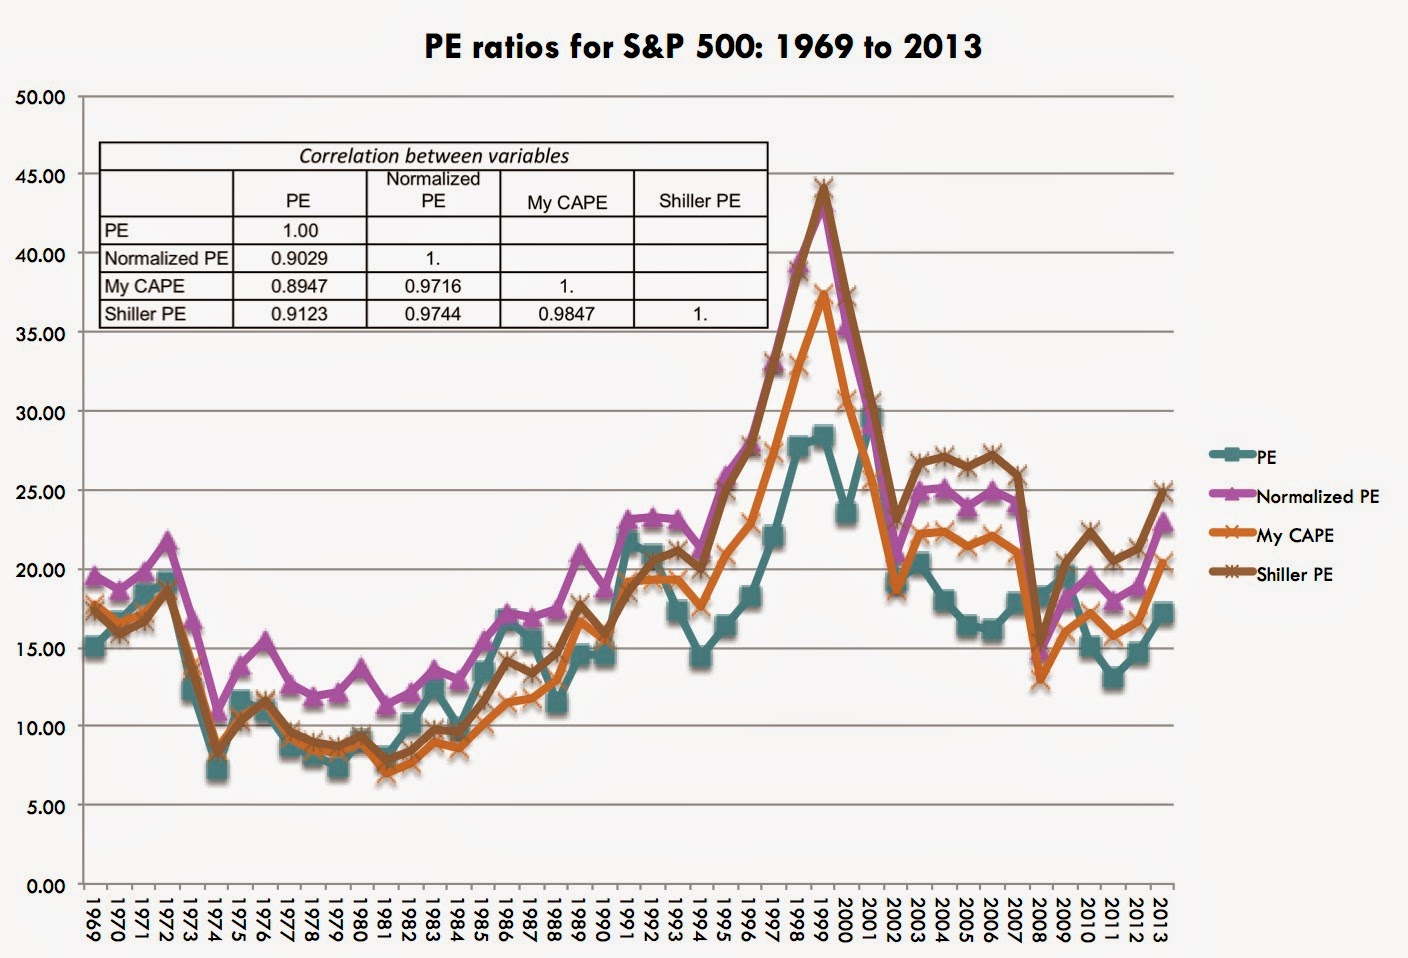
In the graph below, I report on the time trends between 1969 and 2013 in four variants of the PE ratios, a PE using trailing 12 month earnings (PE), a PE based upon the average earnings over the previous ten years (Normalized PE), a PE based upon my estimates of inflation-adjusted average earnings over the prior ten years (My CAPE) and the Shiller PE.
 |
| Normalized PE used average earnings over last 10 years & My CAPE uses my inflation adjusted normalized earnings. Shiller PE is as reported in his datasets |
 |
| T statistics in italics below each correlation; numbers greater than 2.42 indicate significance at 2% level |
 |
| PE measures: 1969-2013 |
 |
| One-year and Two-year stock returns |
b. EP Ratios and Interest Rates
This insight is not new and is the basis for the Fed Model, which looks at the spread between the EP ratio and the T.Bond rate. The premise of the model is that stocks are cheap when the EP ratio exceeds T.Bond rates and expensive when it is lower. To evaluate the predictive power of this spread, I classified the years between 1969 and 2013 into four quartiles, based upon the level of the spread, and computed the returns in the years after (one and two-year horizons):
The results are murkier, but for the most part, stock returns are higher when the EP ratio exceeds the T.Bond rate.
c. Intrinsic Value
Both PE ratios and EP ratio spreads (like the Fed Model) can be faulted for looking at only part of the value picture. A fuller analysis would require us to look at all of the drivers of value, and that can be done in an intrinsic value model. In the picture below, I attempt to do so on June 14, 2014:
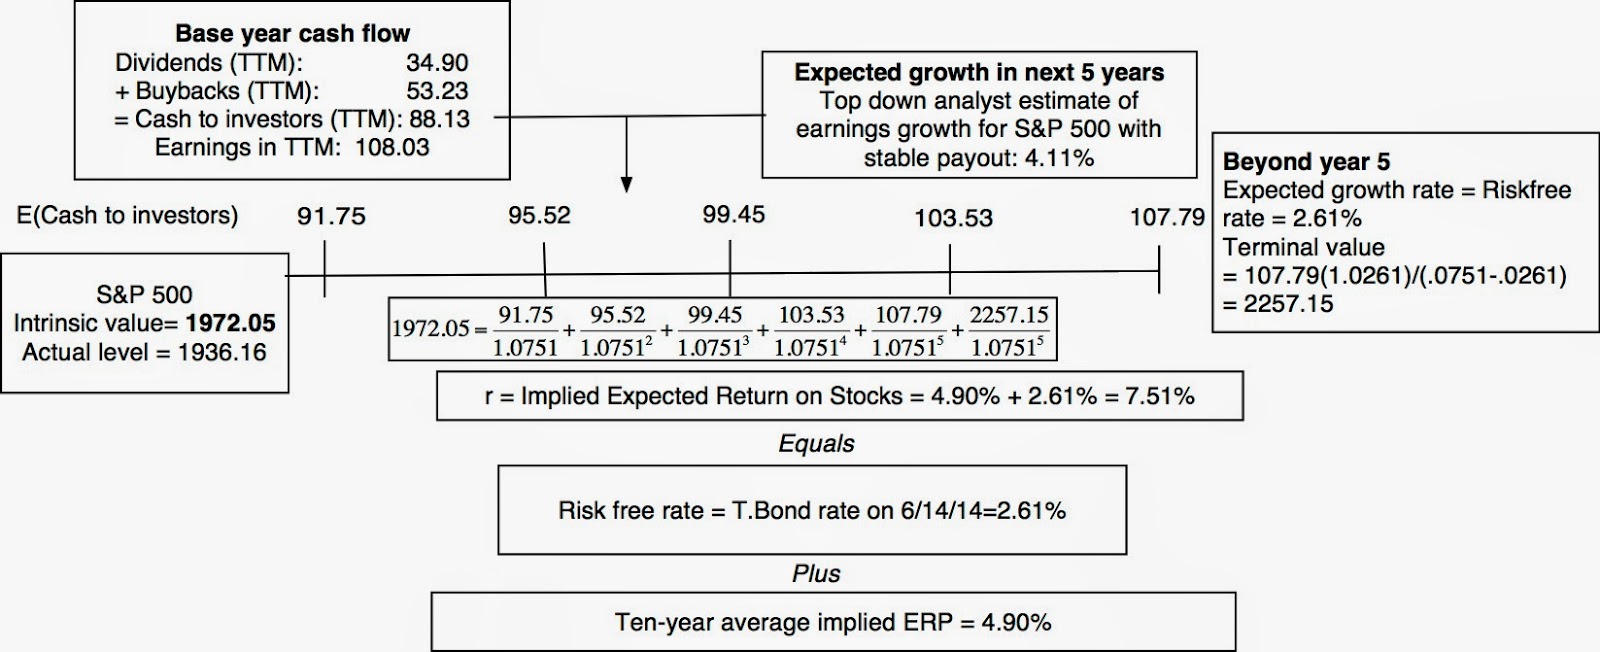 |
| Intrinsic valuation of S&P 500: June 2014 |
The current implied ERP of 4.99% is well above the historic average and median and it clearly is much higher than the 2.05% that prevailed at the end of 1999.
Are we in a bubble?
In the table below, I summarize where the market stands today on each of the metrics that I discussed in the last section:
Bubble Belief to Bubble Action: The Trade Off
- The cost of acting: If you decide to act on a bubble, there is a cost. With the passive defense, the money that you take out of equities has to be invested somewhere safe (earning a risk free rate, or something close to it) and if the correction does not happen, you will lose the return premium you would have earned by investing stocks. With an active defense, the cost of being wrong about the correction is even greater since your losses will increase in direct proportion with how well stocks continue to do. (Note that using derivatives to protect yourself against market corrections or for speculation will deliver variants of these defenses.)
- The benefit of acting: If you are right about the bubble and a correction occurs, there is a payoff to acting. With the passive defense, you protect your investment (or at least that portion that you shift out of equities) from the drop. With the active defense, you profit from the drop, with the magnitude of your profits increasing with the size of the correction.
To illustrate the trade off, consider a simple (perhaps simplistic) scenario, where you are fully invested in equities and believe that there is 20% probability of a market correction (which you expect to be 40%) occurring in 2 years. In addition, let's assume that the expected return on stocks in a normal year (no bubble) is 7.51% annually and that the expected annual return if a bubble exists will be 9% annually, until the bubble bursts. In the table below, I have listed the payoffs to doing nothing (staying 100% in equities) as well as a passive defense (where you sell all your equity and go invest in a risk free asset earning .5%) and an active defense (where you sell short on equities and invest the proceeds in a risk free asset):
 |
| Future value of portfolio in 2 years (when correction occurs) |
If you feel absolute conviction about the existence of a bubble and see a large correction coming immediately or very soon, it clearly pays to act on bubbles and to do so with an active defense. However, that trade off tilts towards inaction as uncertainty about the existence of the bubble increases, its expected magnitude decreases and the longer you will have to wait for the correction to occur. I know that I am pushing my luck here but I tried to assess the trade off in a spreadsheet, where based upon your inputs on these variables, I estimate the net benefit of acting on a bubble for the passive act of moving all of your equity investment into a risk free alternative:
 |
| Payoff to Passive Defense against Bubble (Correction of 40% in 2 years) |
Bubblenomics: My perspective
It is extremely dangerous to disagree with a Nobel prize winner, and even more so, to disagree with two in the same post, but I am going to risk it in this closing section:
- There will always be bubbles: Disagreeing with Gene Fama, I believe that bubbles are part and parcel of financial markets, because investors are human. More data and computerized trading will not make bubbles a thing of the past because data is just as often an instrument for our behavioral foibles as it is an antidote to them and computer algorithms are created by human programmers.
- But bubbles are not as common as we think they are: Parting ways with Robert Shiller, I would propose that bubbles occur infrequently and that they are not always irrational. Most market corrections are rational adjustments to real world shifts and not bubbles bursting and even the most egregious bubbles have rational cores.
- Bubbles are more clearly visible in the rear view mirror: While bubbles always look obvious in hindsight, it is far less obvious when you are in the midst of a bubble.
- Bubbles are not all bad: Bubbles do create damage but they do create change, often for the better. I do know that the much maligned dot-com bubble changed the way we live and do business. In fact, I agree with David Landes, an economic historian, when he asserts that "in this world, the optimists have it, not because they are always right, but because they are positive. Even when wrong, they are positive, and that is the way of achievement, correction, improvement, and success. Educated, eyes-open optimism pays; pessimism can only offer the empty consolation of being right." In market terms, I would rather have a market that is dominated by irrationally exuberant investors than one where prices are set by actuaries. Thus, while I would not invest in Tesla, Twitter or Uber at their existing prices, I am grateful that companies like these exist.
- Doing nothing is often the best response to a bubble: The most rational response to a bubble is to often not change the way you invest. If you believe, as I do, that it is difficult to diagnose when you are in a bubble and if you are in one, to figure when and how it will dissipate, the most sensible response to the fear of a bubble is to not change your asset allocation or investment philosophy. Conversely, if you feel certain about both the existence of a bubble and how it will burst, you may want to see if your certitude is warranted given your metric.
Raw Data used to estimate PE and EP ratios
PE, EP and other ratios by year: 1969-2013
Intrinsic value for S&P 500: June 14, 2014
Trade off on acting on bubbles
That's all from me for today. Take care.
Speak softly and carry a big stick.
~ President Theodore Roosevelt, describing his style of foreign policy which he later explained as "The exercise of intelligent forethought and of decisive action sufficiently far in advance of any likely crisis."
Disclaimer
Research & Investment Pty Ltd is a Corporate Authorized Representative (AR Number 384 397) of Andika Pty Ltd which holds an Australian Financial Services Licence (AFSL 297069).
The information on this web site and in the newsletters is general in nature and does not consider your personal circumstances. Please contact your professional financial adviser for advice tailored to your needs.
Research & Investment Pty Ltd ("R&I") has made every effort to ensure the reliability of the views and recommendations expressed in the reports published on its websites and newsletters. Our research is based upon information known to us or which was obtained from sources which we believe to be reliable and accurate.
No guarantee as to the capital value of investments, nor future returns are made by R&I. Neither R&I nor its employees make any representation, warranty or guarantee that the information provided is complete, accurate, current or reliable.
You are under no obligation to use these services and should always compare financial services/products to find one which best meets your personal objectives, financial situation or needs.
To the extent permitted by law, R&I and its employees, agents and authorised representatives exclude all liability for any loss or damage (including indirect, special or consequential loss or damage) arising from the use of, or reliance on, any information. If the law prohibits the exclusion of such liability, such liability shall be limited, to the extent permitted by law, to the resupply of the said information or the cost of the said resupply.
Important Warning About Simulated Results
Research & Investment (R&I) specialise in developing, testing and researching investment strategies and systems. Within the R&I web site and newsletters, you will find information about investment strategies and their performance. It is important that you understand that results from R&I research are simulated and not actual results.
No representation is made that any investor will or is likely to achieve profits or losses similar to those shown.
Simulated performance results are generally prepared with the benefit of hindsight and do not involve financial risk. No modeling can completely account for the impact of financial risk in actual investment. Account size, brokerage and slippage may also diverge from simulated results. Numerous other factors related to the markets in general or to the implementation of any specific investment system cannot be fully accounted for in the preparation of simulated performance results and may adversely affect actual investment results.
To the extent permitted by law, R&I and its employees, agents and authorised representatives exclude all liability for any loss or damage (including indirect, special or consequential loss or damage) arising from the use of, or reliance on, any information offered by R&I whether or not caused by any negligent act or omission.

Author: Colin Twiggs is a former investment banker with almost 40 years of experience in financial markets. He co-founded Incredible Charts and writes the popular Trading Diary and Patient Investor newsletters.
Using a top-down approach, Colin identifies key macro trends in the global economy before evaluating selected opportunities using a combination of fundamental and technical analysis.
Focusing on interest rates and financial market liquidity as primary drivers of the economic cycle, he warned of the 2008/2009 and 2020 bear markets well ahead of actual events.
He founded PVT Capital (AFSL No. 546090) in May 2023, which offers investment strategy and advice to wholesale clients.


