Consolidation expected
By Colin Twiggs
July 25th, 2014 10:30 a.m. AEST (8:30 p:m EDT)
Advice herein is provided for the general information of readers and does not have regard to any particular person's investment objectives, financial situation or needs. Accordingly, no reader should act on the basis of any information contained herein without first having consulted a suitably qualified financial advisor.
Summary:
- S&P 500 retreats below 1985.
- VIX continues to indicate a bull market.
- ASX 200 breaks resistance.
The S&P 500 retreated below its new support level at 1985, indicating a false break. Consolidation between 1950 and 1985 is likely — below the psychological barrier at 2000. Respect of support at 1950 would confirm. Declining 21-Day Twiggs Money Flow continues to signal mild, medium-term selling pressure. Further resistance is likely at the 2000 level — and at 4000 on the Nasdaq 100. Breakout would offer a long-term target of 2250*.
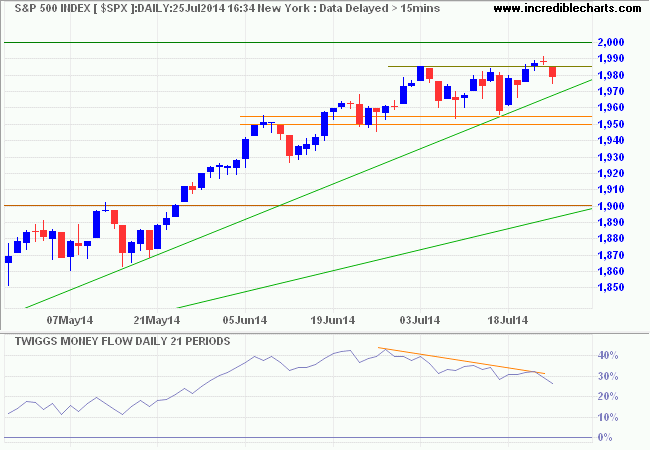
* Target calculation: 1500 + ( 1500 - 750 ) = 2250
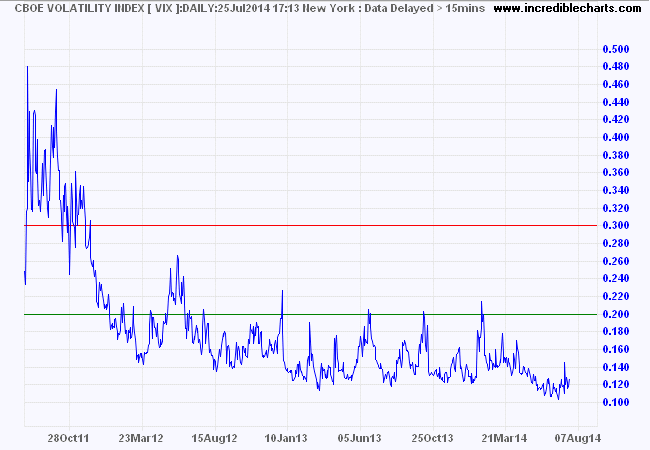
CBOE Volatility Index (VIX) recovered to above 12, but low levels continue to indicate a bull market.
Dow Jones Euro Stoxx 50 is consolidating above medium-term support at 3150. Breach would signal a test of the primary level at 3000. Descent of 13-week Twiggs Money Flow warns of modest long-term selling pressure. Recovery above 3250 is less likely at present, but would suggest a target of 3450*.
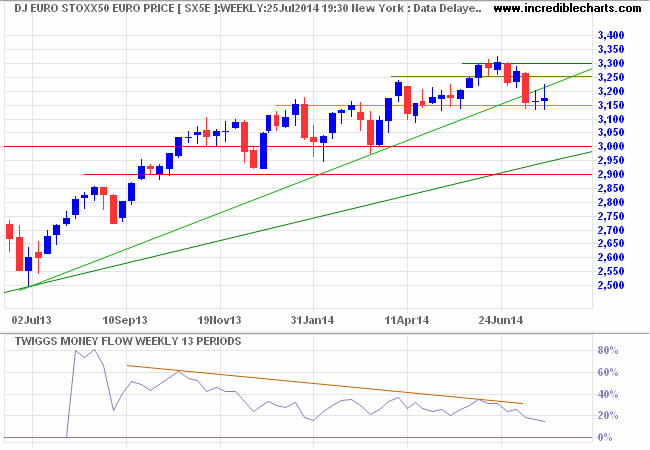
* Target calculation: 3300 + ( 3300 - 3150 ) = 3450
China's Shanghai Composite Index broke resistance at 2100 and is headed for a test of 2150. Breakout would suggest a primary up-trend, but I would wait for confirmation at 2250. Rising 13-week Twiggs Money Flow indicates medium-term buying pressure. Reversal below 2050 is unlikely at present but would warn of another test of primary support at 1990/2000.
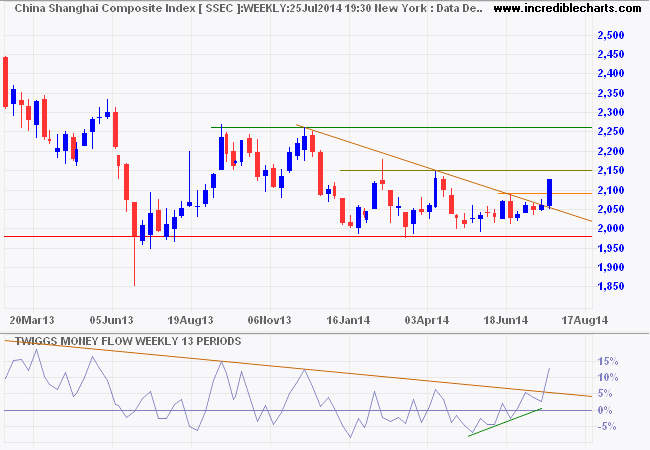
* Target calculation: 2000 - ( 2150 - 2000 ) = 1850
The ASX 200 broke clear of resistance at 5540/5560 on strong results from BHP. Expect retracement to test the new support level, but Friday's long tail and rising 21-day Twiggs Money Flow indicate short-term buying pressure. Respect of support would indicate a long-term advance to 5800*. Reversal below 5540 is unlikely, but would warn of a correction.
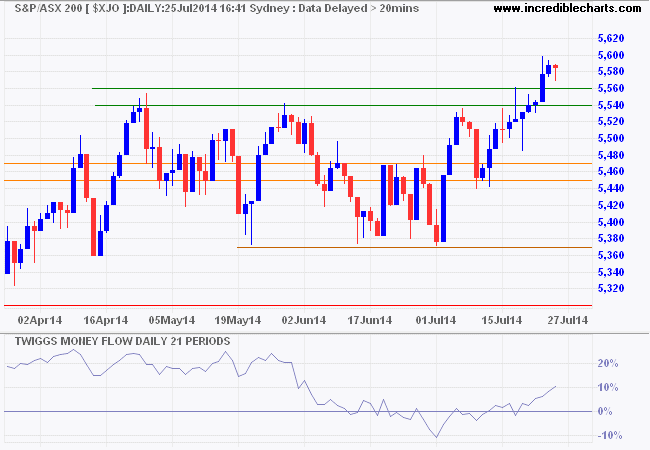
* Target calculation: 5400 + ( 5400 - 5000 ) = 5800
Diversification — the only 'free lunch' in investing
Diversification is often referred to as "the only free lunch in investing" because it affords investors the opportunity to reduce investment risk without reducing returns. Most investments involve a trade-off between risk and return, with higher returns requiring investors to expose themselves to greater risk. But effective diversification allows investors to reduce risk, by spreading their investments, while maintaining higher levels of return.
What is effective diversification?
Not all diversification is effective. Many investors buy a wide range of stocks in the belief that this will protect them from risk. The benefits of such diversification are marginal if the stocks are all listed on the same exchange and selected using the same method. The entire portfolio is likely to rise and fall in unison — as in the well-known adage "a rising tide lifts all boats." The key is to select stocks or investments that have low correlation.
What is correlation?
Correlation is the degree to which separate investments rise and fall together. Correlation measures the tendency of investments to advance or decline independently of each other. The correlation coefficient, identified by the symbol r, expresses the level of dependency between two variables (stocks in our case). Values for the correlation coefficient range from 1.0, for stocks that a perfectly correlated, to -1.0 for stocks that move inversely to each other.
Only two shares of the same stock, like BHP Billiton, are likely to have a correlation as high as 1.0. But stocks from the same sector are likely to share high values. And stocks from the same market are also likely to share a reasonable degree of correlation in larger time frames (i.e. the primary cycle).
You are also unlikely to find stocks that are the perfect inverse of each other — a coefficient of -1.0 — other than if you go long and short the same stock.
We are not necessarily looking for stocks with negative correlation, however, but investments with low correlation — a coefficient as close to zero as possible. As you can imagine, going long and short the same stock would protect you from any variation in prices, but would not deliver much in the way of return. If we had a spread of investments with close to zero correlation (i.e low dependency) their price movements will tend to offset each other, providing a smoother portfolio return.
3 Ways to achieve diversification
We are likely to find investments with low correlation using three different techniques:
- Diversification by asset class;
- Diversification by geographic location; and
- Diversification by strategy.
Asset class
There are a number of asset classes available to investors. Asset classes as diverse as stocks, real estate and fine art, however, are all subject the vagaries of the economic cycle and tend to rise and fall together.
Bonds tend to have low correlation to stocks. We need to make a distinction here between government bonds with low risk premiums, which fluctuate largely with the interest rate cycle and tend to be counter-cyclical (i.e negatively correlated) to stocks, and corporate bonds which are subject to far higher risk premiums that may expand and contract in line with the stock market cycle. Credit spreads tend to be low when the stock market is bullish and widen sharply during a contraction.
There are other asset classes such as insurance funds, where risks such as weather events tend to have low correlation to the economic cycle, but investors need a fair degree of expertise to assess the risks associated with these investments.
Geographic location
Australian investors tend to be highly concentrated in the Australian market, with only about 15% of assets invested offshore, both directly and indirectly through managed funds. Most major stock markets tend to rise and fall together, but diversification, especially to US markets, affords investors the opportunity to diversify into sectors not available on the local exchange.
By strategy
Diversification by strategy is often overlooked. If an investor, for example, diversifies their stock portfolio across several value-based fund managers they are likely to find that their investments rise and fall in unison. Even though the managers may hold a wide spread of stocks, they are all selected using a similar process and will tend to behave in a similar manner.
By spreading investments across several strategies, the investor is likely to achieve more effective diversification and more stable returns. Diversification between value-based strategies and our own momentum strategy is an obvious example. Recent research shows ASX 200 Prime Momentum has a low correlation of 0.3368 with the popular Perpetual Industrial Share Fund [PER0011AU] and moderate correlation of 0.4263 with Colonial First State Australian Share - Core [FSF0238AU].
Diversification is not the only "free lunch" available to investors — effective tax planning also enables investors to enhance returns without increasing risk — but it is important and should not be neglected. It is a complex area and we recommend that you consult your financial adviser before taking any action.
That's all for today. Take care.
The best argument for mutual funds is that they offer safety and diversification. But they don't necessarily offer safety and diversification.
~ Ron Chernow
Disclaimer
Research & Investment Pty Ltd is a Corporate Authorized Representative (AR Number 384 397) of Andika Pty Ltd which holds an Australian Financial Services Licence (AFSL 297069).
The information on this web site and in the newsletters is general in nature and does not consider your personal circumstances. Please contact your professional financial adviser for advice tailored to your needs.
Research & Investment Pty Ltd ("R&I") has made every effort to ensure the reliability of the views and recommendations expressed in the reports published on its websites and newsletters. Our research is based upon information known to us or which was obtained from sources which we believe to be reliable and accurate.
No guarantee as to the capital value of investments, nor future returns are made by R&I. Neither R&I nor its employees make any representation, warranty or guarantee that the information provided is complete, accurate, current or reliable.
You are under no obligation to use these services and should always compare financial services/products to find one which best meets your personal objectives, financial situation or needs.
To the extent permitted by law, R&I and its employees, agents and authorised representatives exclude all liability for any loss or damage (including indirect, special or consequential loss or damage) arising from the use of, or reliance on, any information. If the law prohibits the exclusion of such liability, such liability shall be limited, to the extent permitted by law, to the resupply of the said information or the cost of the said resupply.
Important Warning About Simulated Results
Research & Investment (R&I) specialise in developing, testing and researching investment strategies and systems. Within the R&I web site and newsletters, you will find information about investment strategies and their performance. It is important that you understand that results from R&I research are simulated and not actual results.
No representation is made that any investor will or is likely to achieve profits or losses similar to those shown.
Simulated performance results are generally prepared with the benefit of hindsight and do not involve financial risk. No modeling can completely account for the impact of financial risk in actual investment. Account size, brokerage and slippage may also diverge from simulated results. Numerous other factors related to the markets in general or to the implementation of any specific investment system cannot be fully accounted for in the preparation of simulated performance results and may adversely affect actual investment results.
To the extent permitted by law, R&I and its employees, agents and authorised representatives exclude all liability for any loss or damage (including indirect, special or consequential loss or damage) arising from the use of, or reliance on, any information offered by R&I whether or not caused by any negligent act or omission.

Author: Colin Twiggs is a former investment banker with almost 40 years of experience in financial markets. He co-founded Incredible Charts and writes the popular Trading Diary and Patient Investor newsletters.
Using a top-down approach, Colin identifies key macro trends in the global economy before evaluating selected opportunities using a combination of fundamental and technical analysis.
Focusing on interest rates and financial market liquidity as primary drivers of the economic cycle, he warned of the 2008/2009 and 2020 bear markets well ahead of actual events.
He founded PVT Capital (AFSL No. 546090) in May 2023, which offers investment strategy and advice to wholesale clients.
