Gold retreats as Dollar strengthens
By Colin Twiggs
July 24th, 2014 2:00 a.m. EDT (4:00 p.m. AEST)
These extracts from my trading diary are for educational purposes. Any advice contained therein is provided for the general information of readers and does not have regard to any particular person's investment objectives, financial situation or needs and must not be construed as advice to buy, sell, hold or otherwise deal with any securities or other investments. Accordingly, no reader should act on the basis of any information contained therein without first having consulted a suitably qualified financial advisor. Full terms and conditions can be found at Terms of Use.
- Treasury yields weaken further
- The Dollar continues to strengthen
- Inflation target remains at 2% p.a.
- Gold retreats
Interest Rates and the Dollar
The yield on ten-year Treasury Notes broke support at 2.50 percent, indicating a test of 2.00 percent*. 13-Week Twiggs Momentum below zero warns of a primary down-trend. Follow-through below 2.40 would confirm. Recovery above 2.65 is unlikely, but would indicate the correction is over, with a medium-term target of 2.80 and long-term of 3.00 percent.
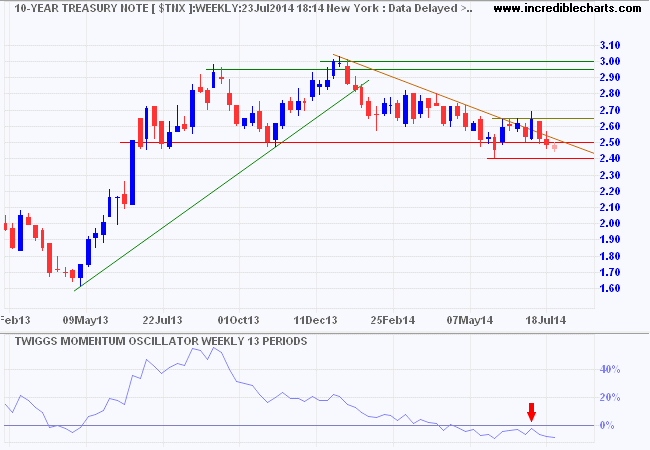
* Target calculation: 2.50 - ( 3.00 - 2.50 ) = 2.00
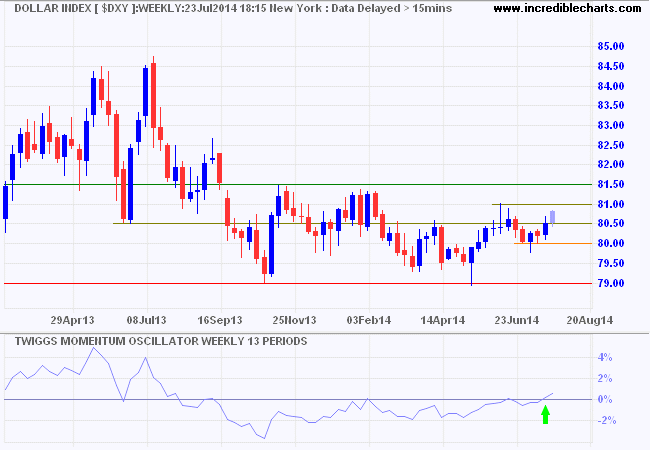
The Dollar Index followed-through above 80.50 and is headed for another test of 81.00. Recovery of 13-week Twiggs Momentum above zero suggests a primary up-trend. Breakout above 81.00 would strengthen the signal; and 81.50 would confirm. Breach of 80.00 is unlikely at present, but would warn of another test of primary support at 79.00.
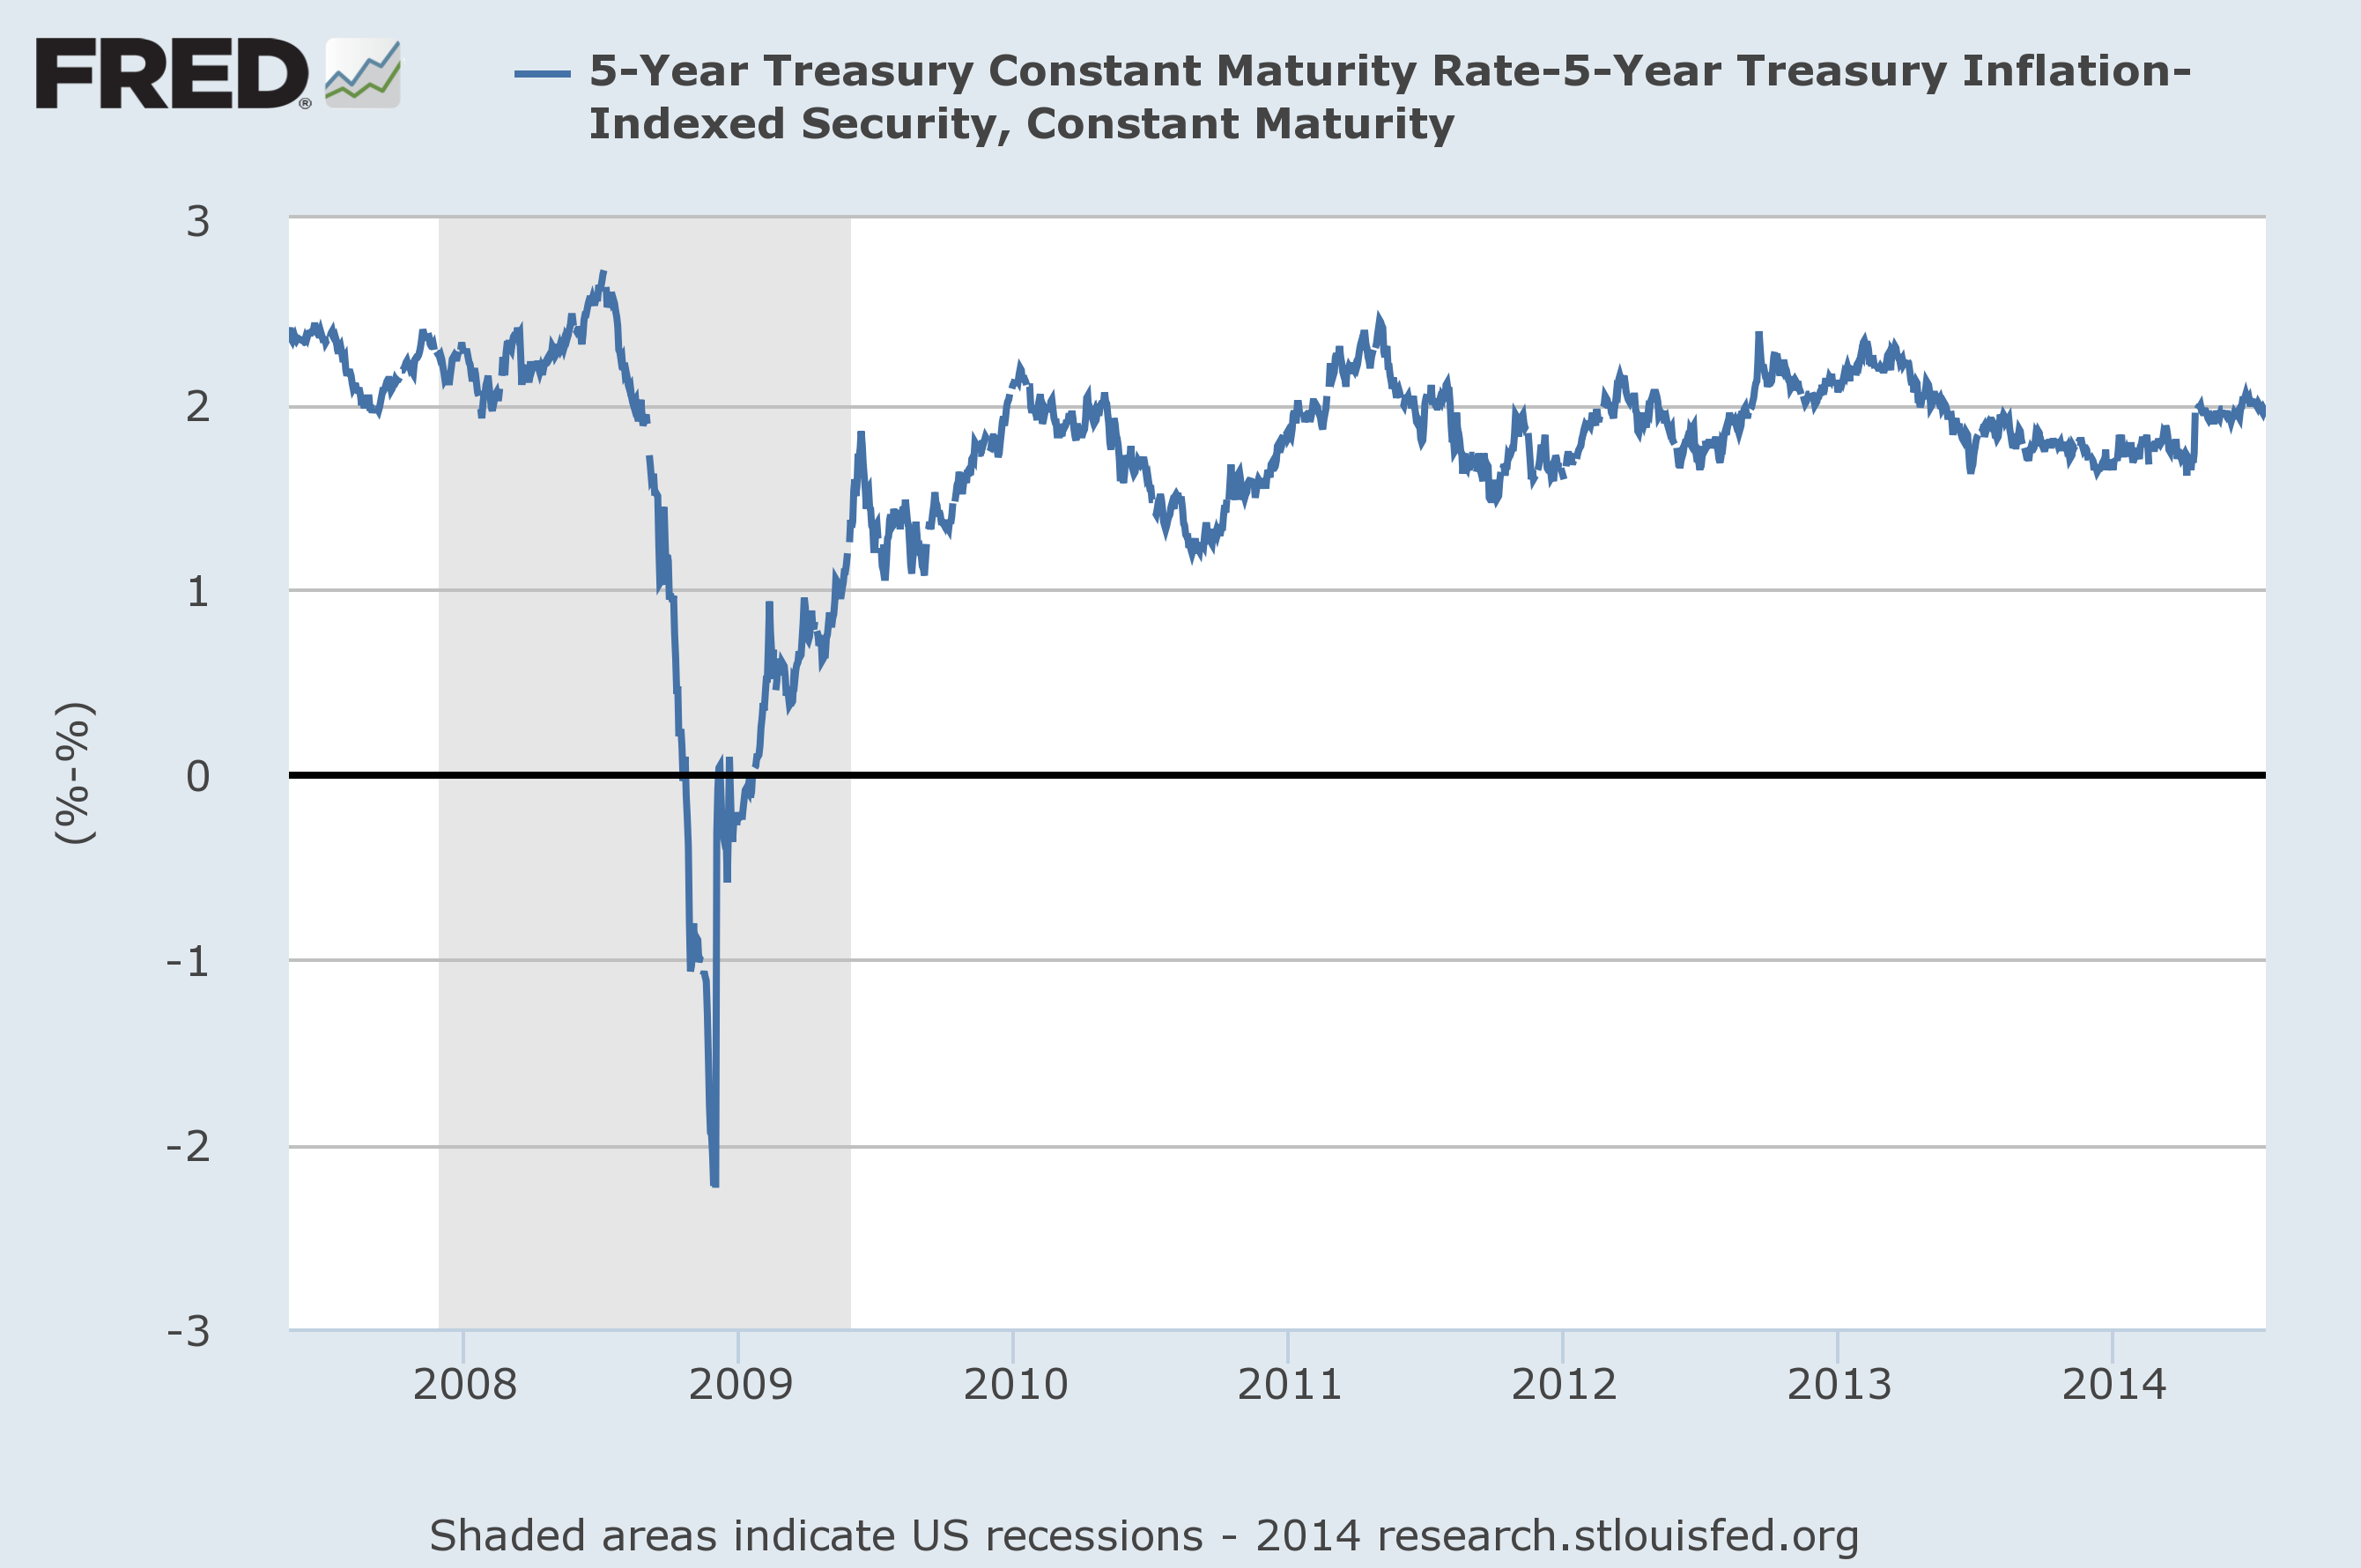
Low interest rates and a stronger dollar suggest inflation expectations are falling, but this is not yet evident on the TIPS spread. The 5-year Breakeven rate (5-Year Treasury Yield minus 5-Year Inflation-Indexed Yield) remains at 2.0 percent.
Gold
Gold is nonetheless falling, in line with weaker inflation expectations. Breach of short-term support at $1295/$1300 would test $1240/$1250. And breach of $1240 would signal another primary decline, with an intermediate target of $1100*. Oscillation of 13-week Twiggs Momentum around zero, however, suggests hesitancy, with no strong trend. Recovery above $1350 is unlikely at present, but would indicate another test of $1400/$1420.
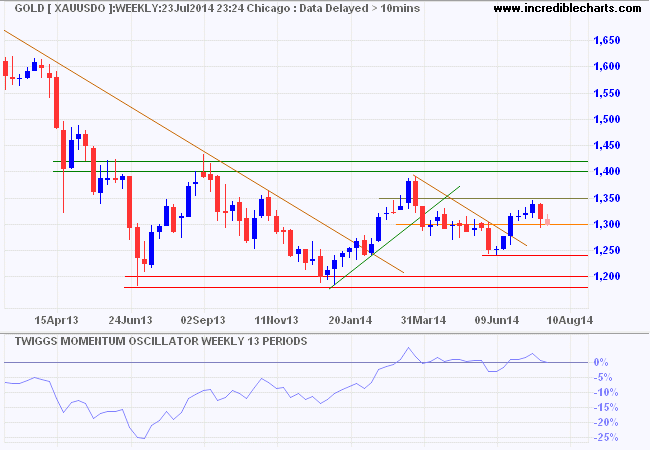
* Target calculation: 1250 - ( 1400 - 1250 ) = 1100
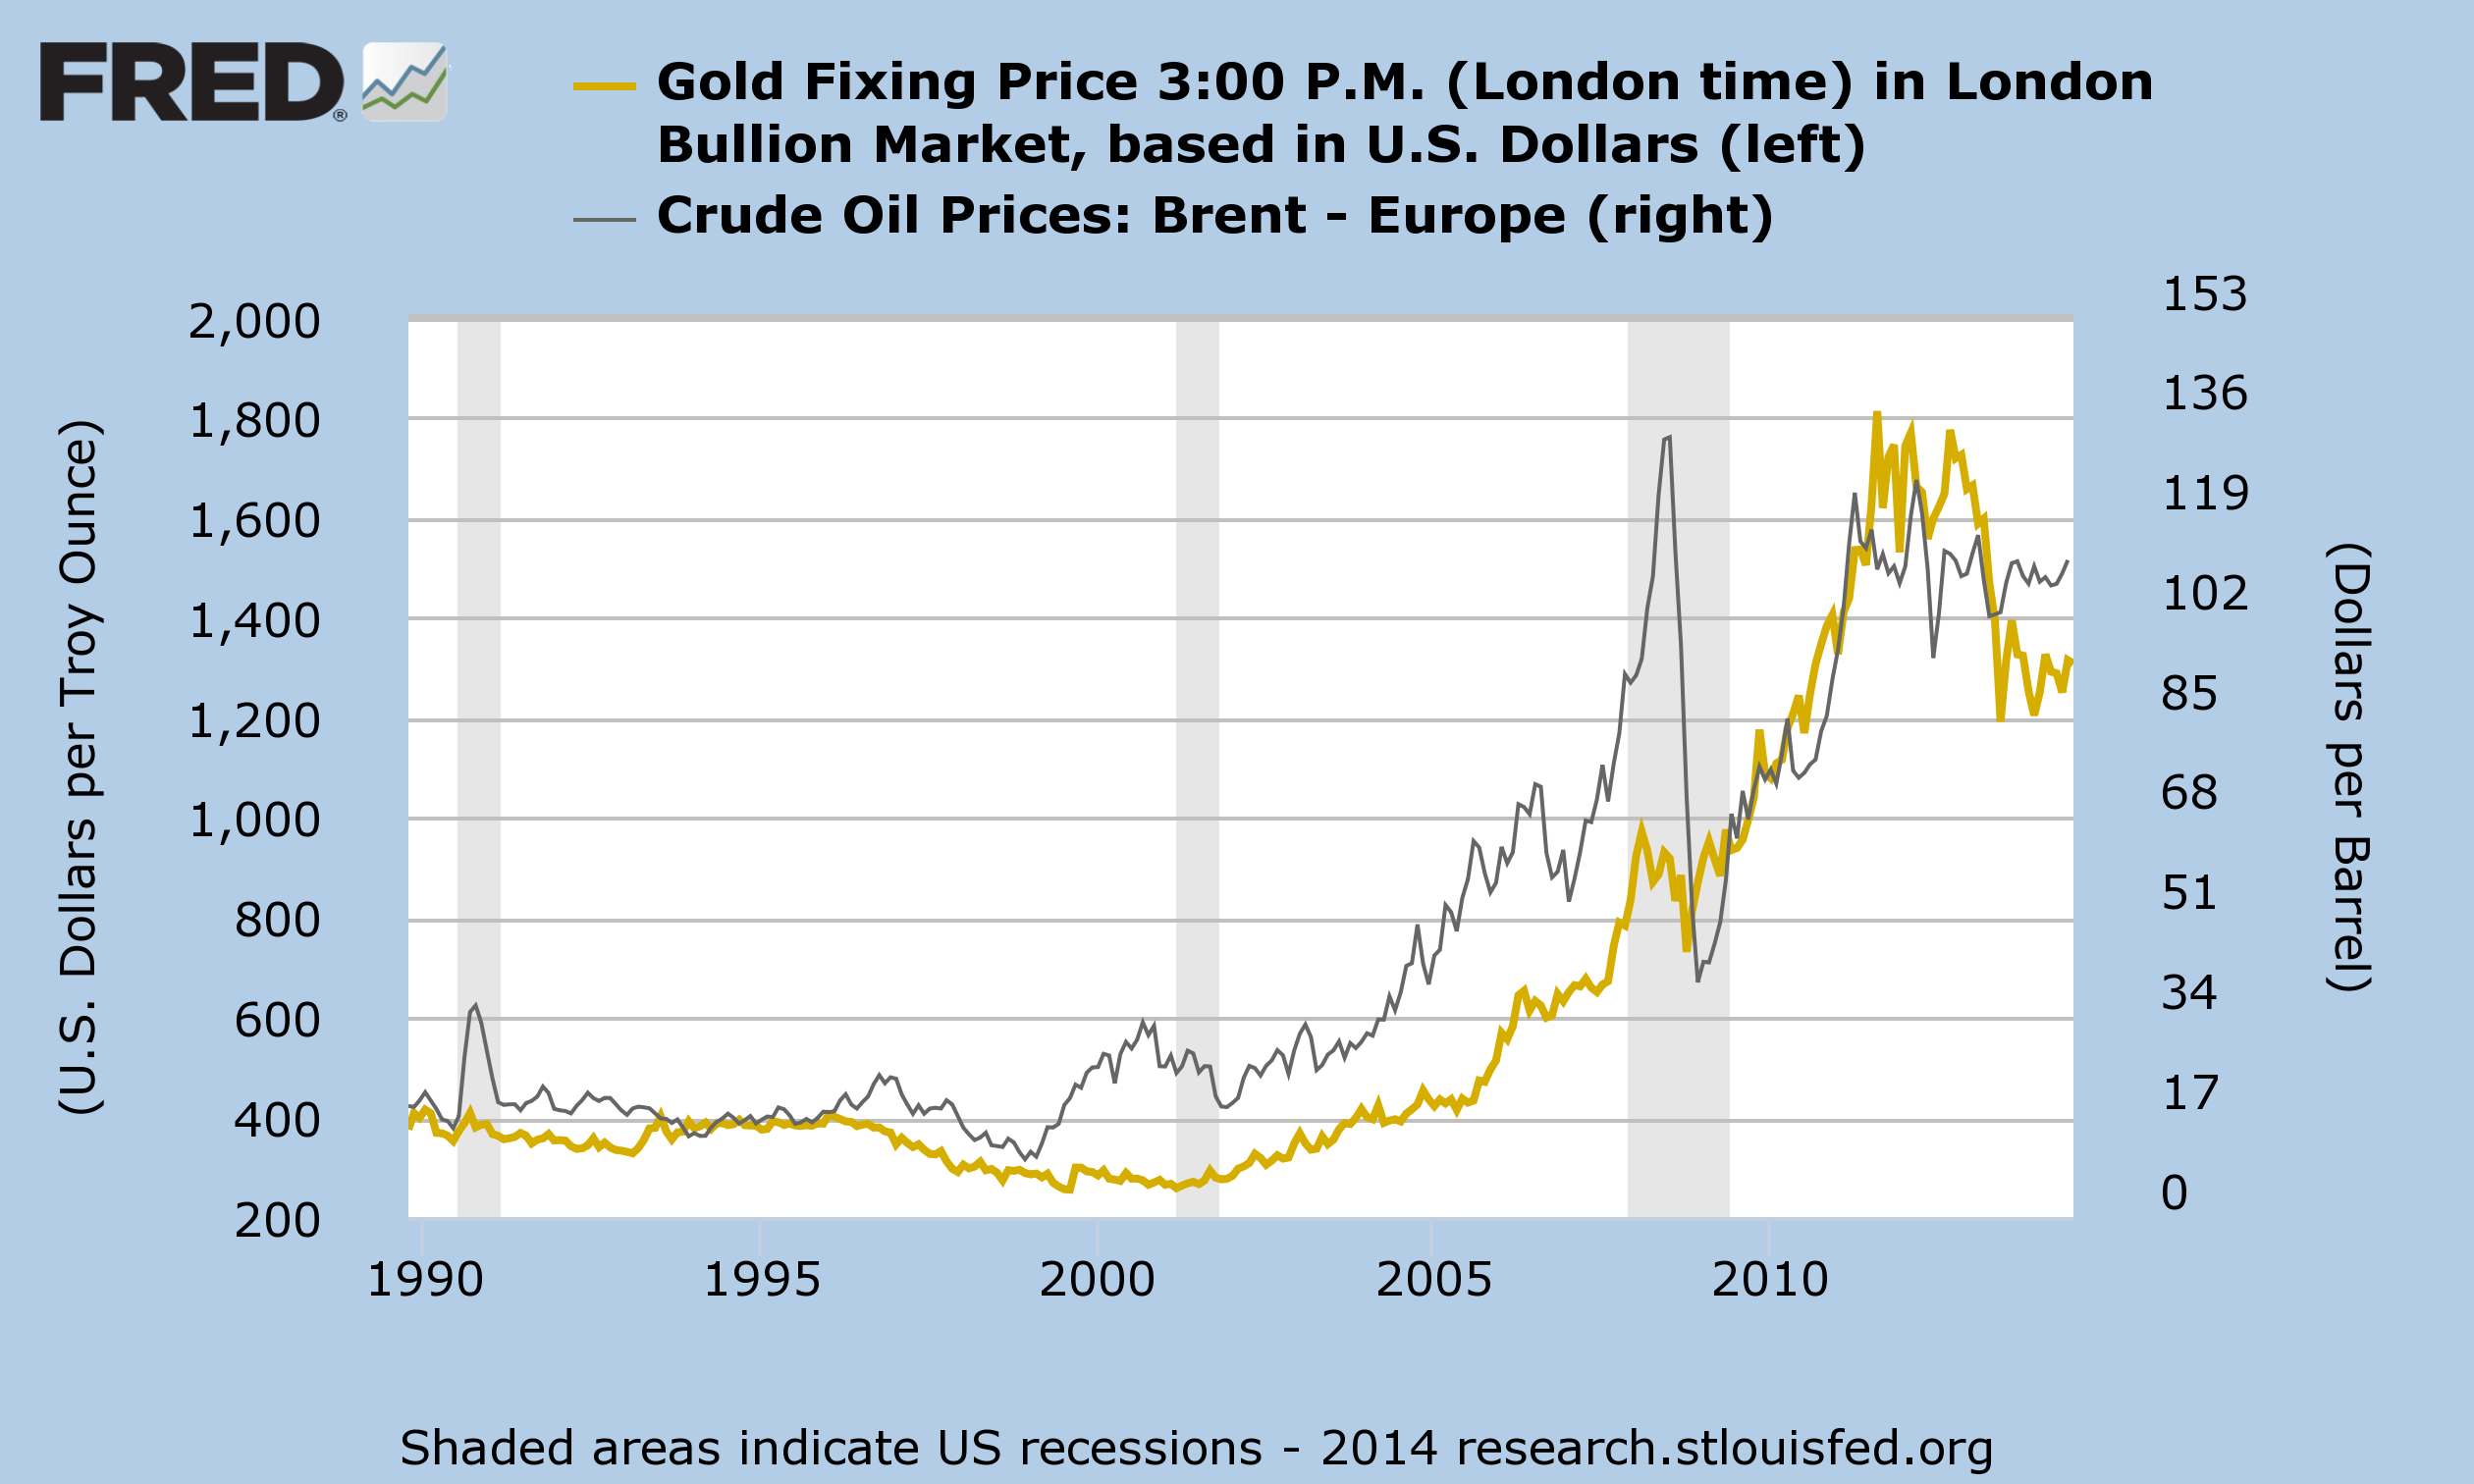
When we compare long-term crude prices (Brent Crude) to gold, it is evident that crude prices tend to lead and gold to follow. The main reason is the impact that higher crude prices have on inflation, increasing demand for gold as an inflation hedge. Crude prices currently remain high, but it remains to be seen whether gold will follow as usual.
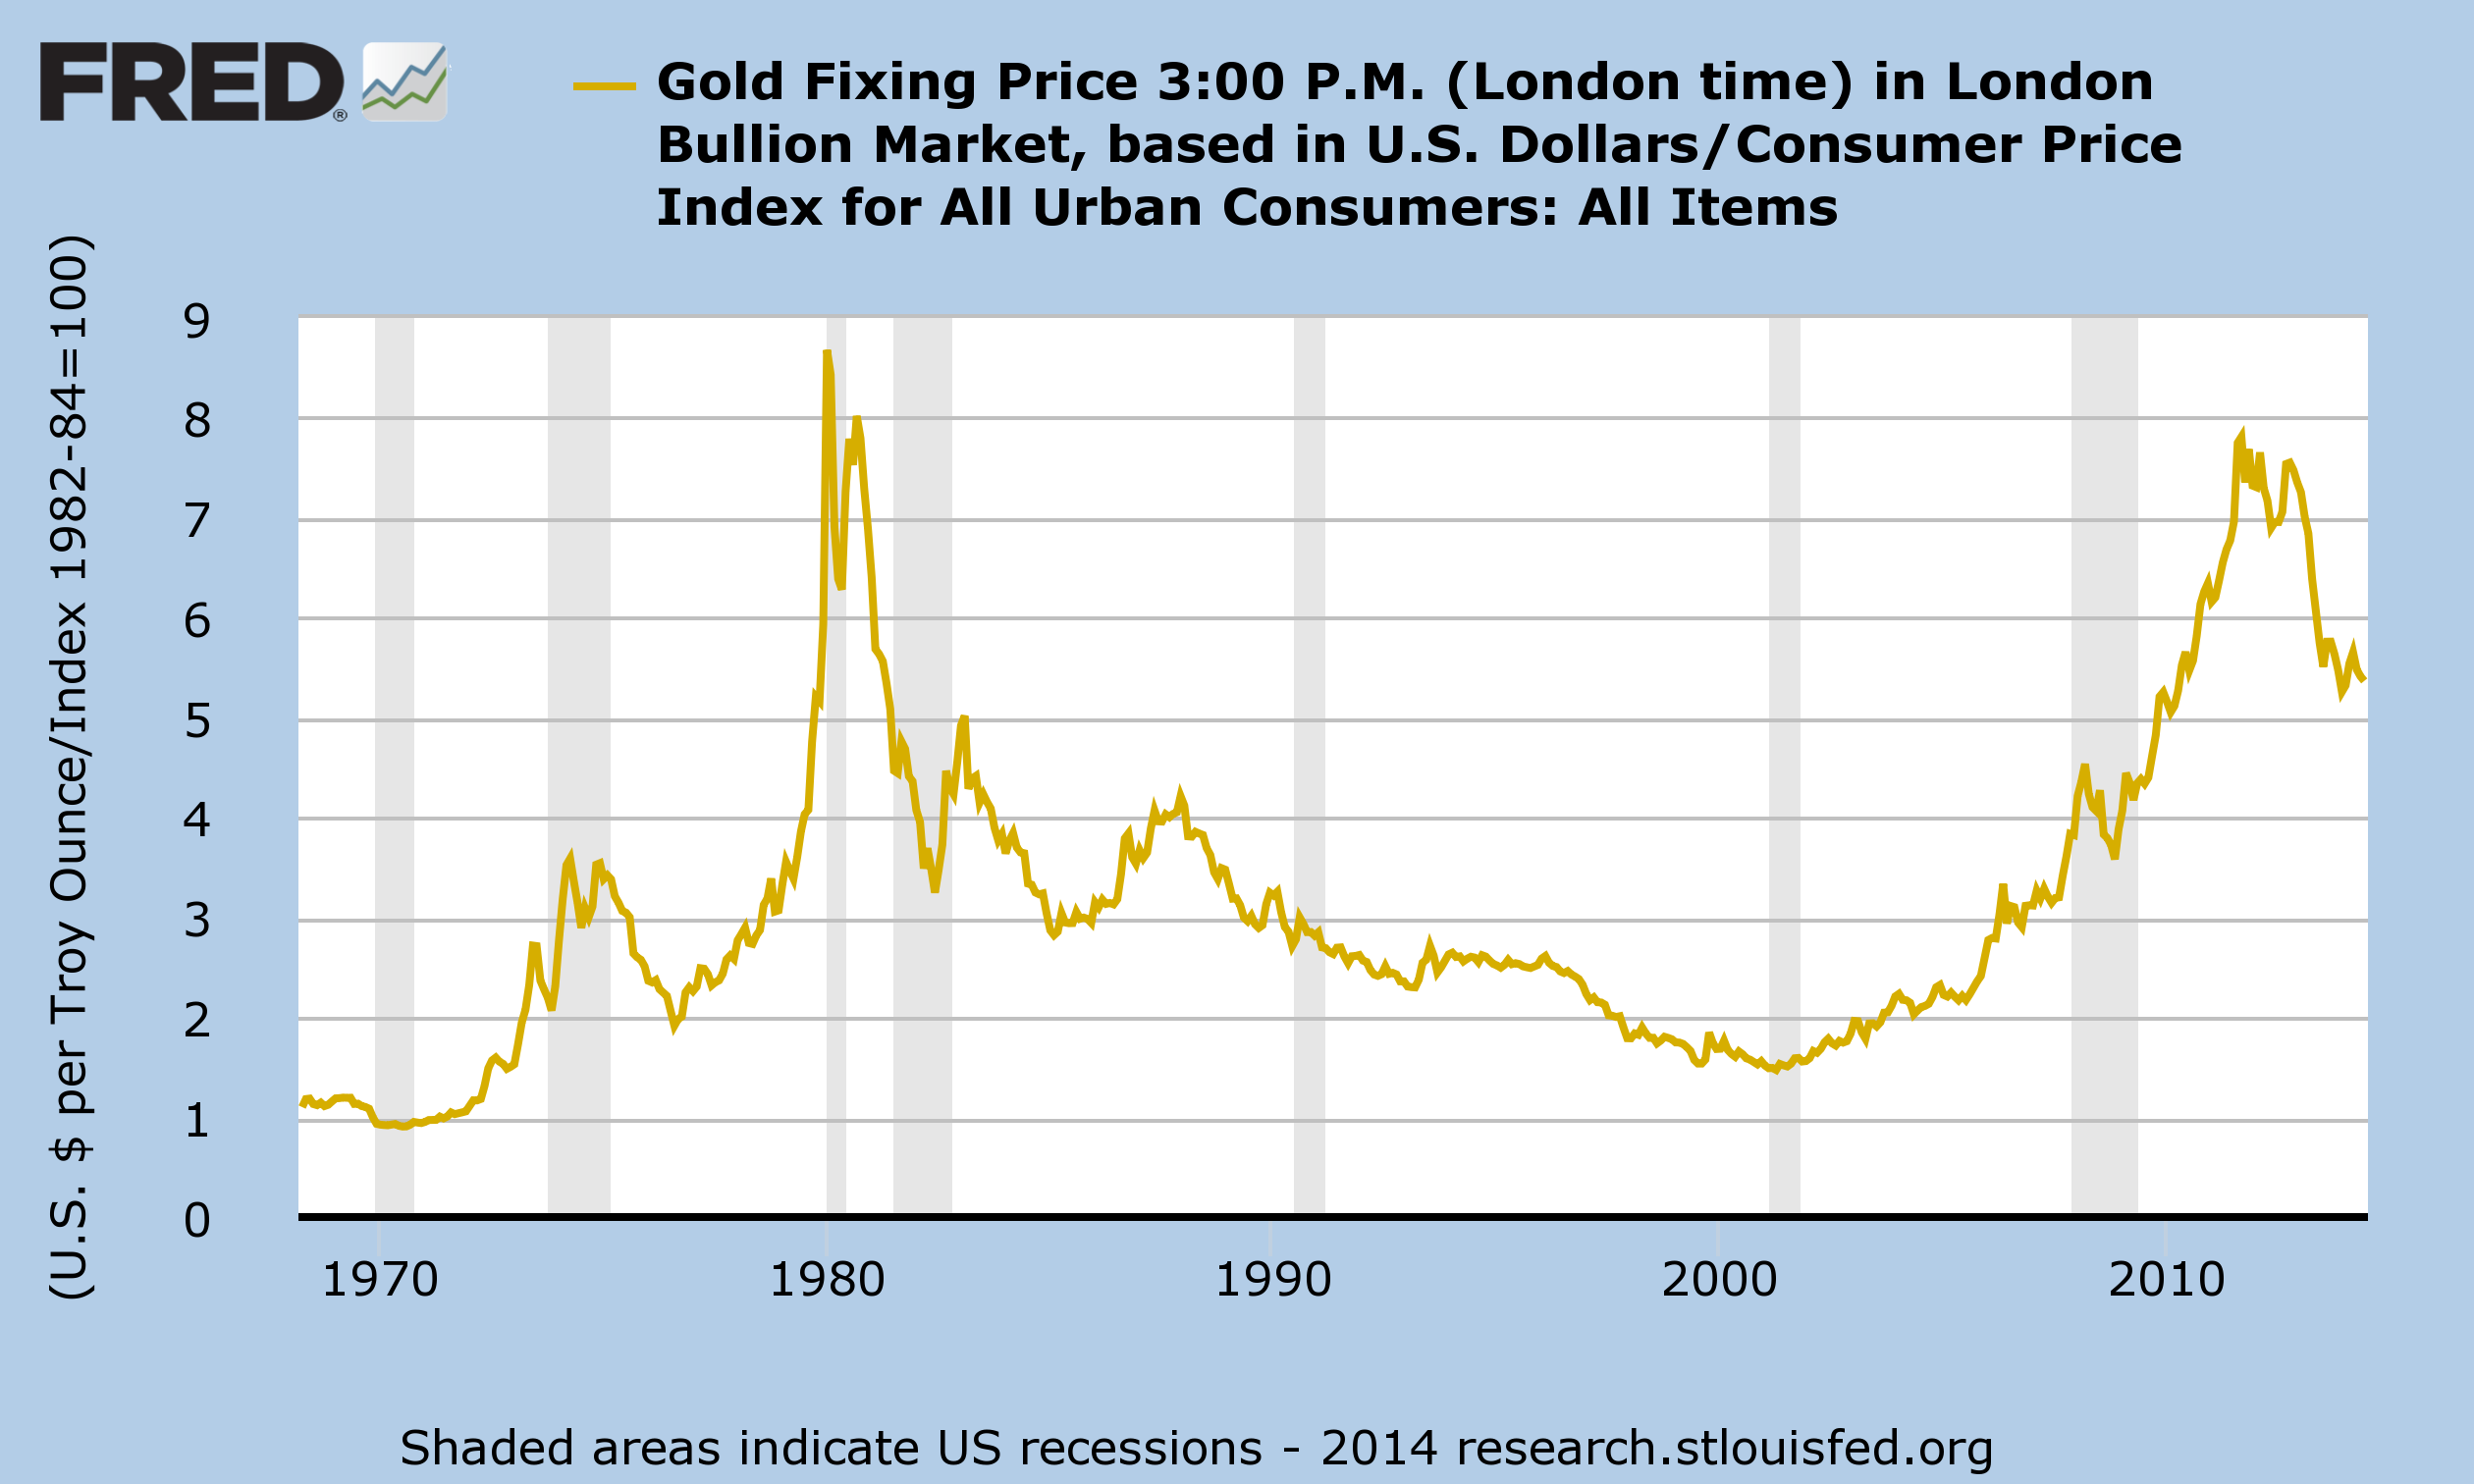
Gold prices adjusted for inflation suggest the opposite. There are two enormous spikes on the chart, both flagging times of great financial uncertainty. The first is spiraling inflation of the early 1980s and the second is the all-in balance sheet expansion (also known as quantitative easing) by central banks after the global financial crisis. Gold prices remain elevated and are likely to fall further as central banks curtail expansion.
All that is gold does not glitter,
Not all those who wander are lost;
The old that is strong does not wither,
Deep roots are not reached by the frost...~ J.R.R. Tolkien, The Fellowship of the Ring

Author: Colin Twiggs is a former investment banker with almost 40 years of experience in financial markets. He co-founded Incredible Charts and writes the popular Trading Diary and Patient Investor newsletters.
Using a top-down approach, Colin identifies key macro trends in the global economy before evaluating selected opportunities using a combination of fundamental and technical analysis.
Focusing on interest rates and financial market liquidity as primary drivers of the economic cycle, he warned of the 2008/2009 and 2020 bear markets well ahead of actual events.
He founded PVT Capital (AFSL No. 546090) in May 2023, which offers investment strategy and advice to wholesale clients.
