S&P 500 pregnant pause
By Colin Twiggs
July 19th, 2014 8:30 a.m. AEST (6:30 p:m EDT)
Advice herein is provided for the general information of readers and does not have regard to any particular person's investment objectives, financial situation or needs. Accordingly, no reader should act on the basis of any information contained herein without first having consulted a suitably qualified financial advisor.
Research & Investment: Performance update
ASX200 Prime Momentum strategy returned +27.60%* for the 12 months ended 30th June 2014, outperforming the benchmark ASX200 Accumulation Index by +10.17%.
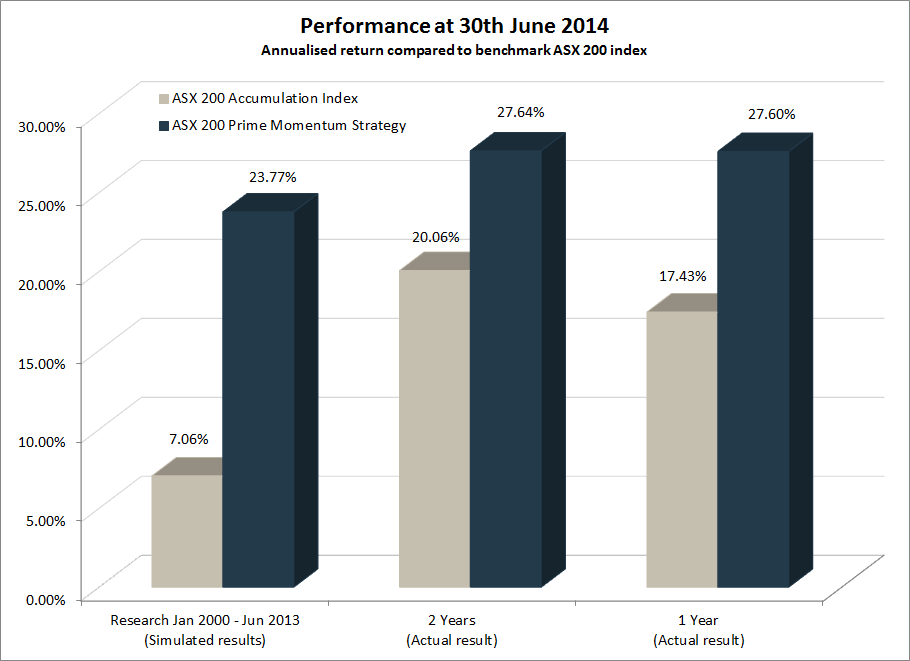
The S&P 500 Prime Momentum strategy has been running eight months, since November 2013, and returned 13.41%* for the period, compared to 13.06% for the S&P 500 Total Return Index. A sell-off of momentum stocks affected performance in April, but macroeconomic and volatility filters indicate low risk typical of a bull market and we maintain full exposure to equities.
* Results are unaudited and subject to revision.
Pregnant pause
Summary:
- S&P 500 advance to 2000 likely.
- VIX continues to indicate a bull market.
- ASX 200 finds support.
A Harami candlestick formation on the S&P 500 suggests continuation of the up-trend. Harami means 'pregnant' in Japanese. Expect a test of the psychological barrier at 2000. 21-Day Twiggs Money Flow recovery above the descending trendline would confirm that short-term selling pressure has ended. Further resistance is likely at the 2000 level — and at 4000 on the Nasdaq 100. Short retracement or narrow consolidation would suggest another advance. Reversal below 1950 is unlikely, but would warn of a correction to 1900 and the rising trendline.
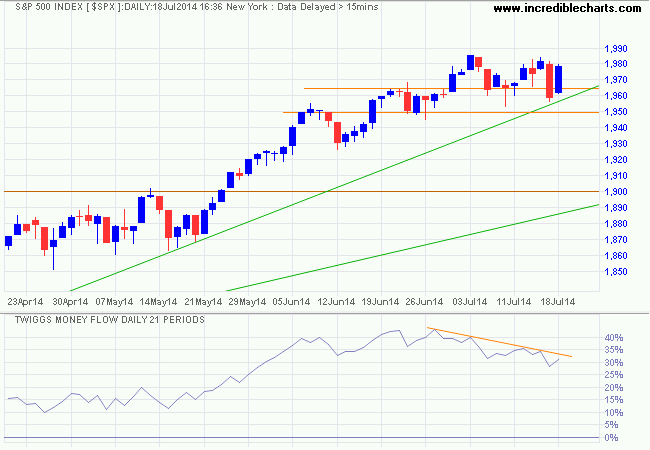
* Target calculation: 1900 + ( 1900 - 1800 ) = 2000
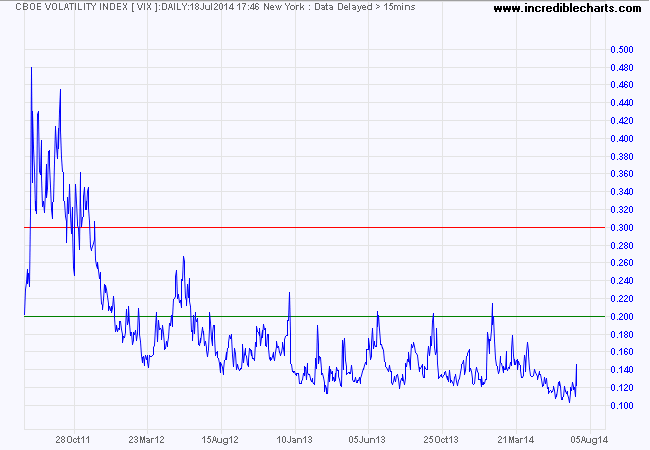
CBOE Volatility Index (VIX) spiked to 15 on news of the Israeli incursion into Gaza and the downing of Malaysian airlines flight MH17 over Eastern Ukraine, but soon retreated to 12 and remains indicative of a bull market.
The ASX 200 retreated below support at 5525/5530 on the hourly chart, but long tails at 5500 indicate buying pressure and another attempt at 5550 is likely. An open above 5530 would confirm. Breakout above 5550 would suggest a long-term advance to 5800*. Reversal below 5450 is unlikely, but would signal another test of 5350.
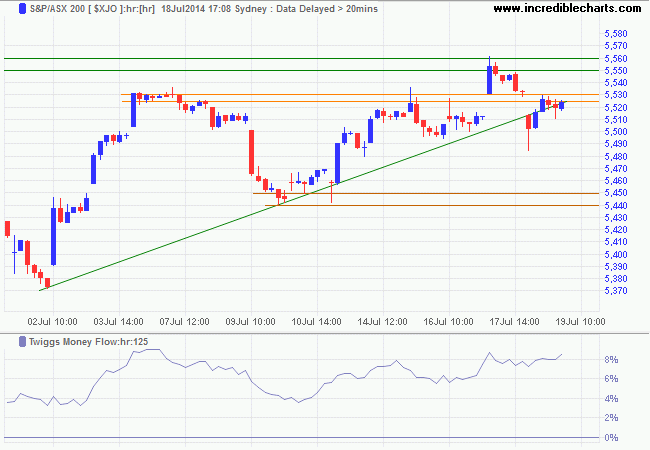
* Target calculation: 5400 + ( 5400 - 5000 ) = 5800
To sell or not to sell?
Recent acquisition Northern Star Resources [NST] in the ASX 200 portfolio is a great example of the conundrum faced by long-term investors when a new stock leaps out of the starting blocks. Profit-taking is evident from the tall shadows/wicks early in the week and the decline of 21-day Twiggs Money Flow. Medium-term selling pressure suggests the stock is likely to retrace and give back some of the gains of the last two weeks. The temptation must be great to sell the stock and lock in profits of close to 30 percent.
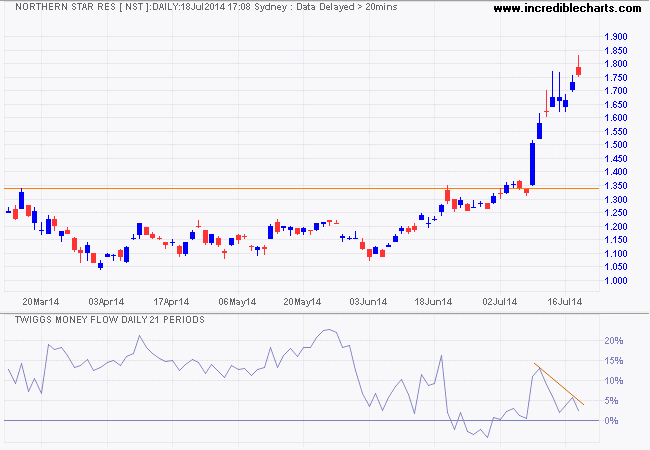
It is important, however, to stick to the plan. We are investing for a longer time frame in anticipation of much larger gains. There is no guarantee that any individual stock, including NST, will deliver. But I can guarantee you that they will not deliver long-term gains if you sell within the first few weeks.
Investors in S&P 500 stock Micron Technology [MU] faced a similar conundrum in July 2013. The stock had put in a good run from $9.00 before encountering profit-taking as it approached $15.00. 21-Day Twiggs Money Flow retreated below zero and the stock fell back to $12.50. Many investors would have taken this as a sign to get out.
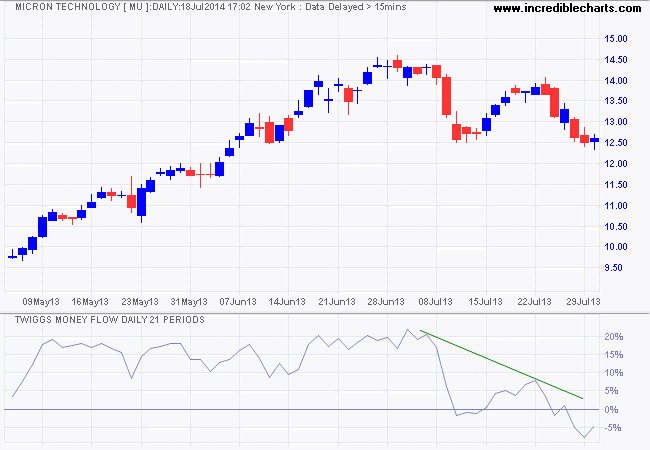
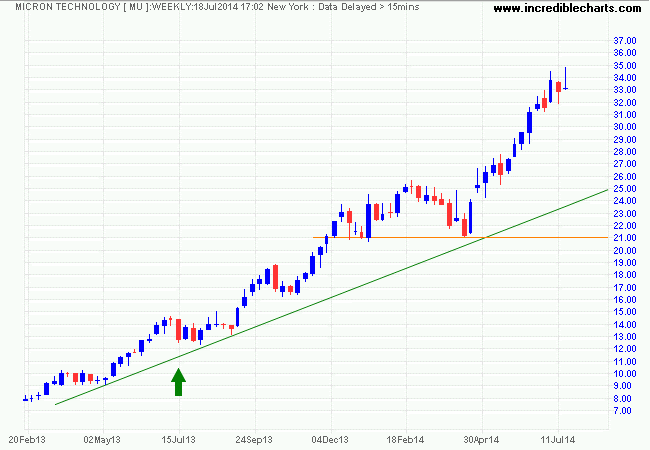
With hindsight, the decision to stay the course looks easy: support held at $12.50 and MU is now trading at $33.00. But I am sure that there were many investors who forgot their original plan and took profits at $12.50 ....They just aren't bragging about it.
That's all for today. Take care.
Disregarding the big swing and trying to jump in and out was fatal to me. Nobody can catch all the fluctuations. In a bull market the game is to buy and hold until you believe the bull market is near its end.
~ Jesse Livermore
Disclaimer
Research & Investment Pty Ltd is a Corporate Authorized Representative (AR Number 384 397) of Andika Pty Ltd which holds an Australian Financial Services Licence (AFSL 297069).
The information on this web site and in the newsletters is general in nature and does not consider your personal circumstances. Please contact your professional financial adviser for advice tailored to your needs.
Research & Investment Pty Ltd ("R&I") has made every effort to ensure the reliability of the views and recommendations expressed in the reports published on its websites and newsletters. Our research is based upon information known to us or which was obtained from sources which we believe to be reliable and accurate.
No guarantee as to the capital value of investments, nor future returns are made by R&I. Neither R&I nor its employees make any representation, warranty or guarantee that the information provided is complete, accurate, current or reliable.
You are under no obligation to use these services and should always compare financial services/products to find one which best meets your personal objectives, financial situation or needs.
To the extent permitted by law, R&I and its employees, agents and authorised representatives exclude all liability for any loss or damage (including indirect, special or consequential loss or damage) arising from the use of, or reliance on, any information. If the law prohibits the exclusion of such liability, such liability shall be limited, to the extent permitted by law, to the resupply of the said information or the cost of the said resupply.
Important Warning About Simulated Results
Research & Investment (R&I) specialise in developing, testing and researching investment strategies and systems. Within the R&I web site and newsletters, you will find information about investment strategies and their performance. It is important that you understand that results from R&I research are simulated and not actual results.
No representation is made that any investor will or is likely to achieve profits or losses similar to those shown.
Simulated performance results are generally prepared with the benefit of hindsight and do not involve financial risk. No modeling can completely account for the impact of financial risk in actual investment. Account size, brokerage and slippage may also diverge from simulated results. Numerous other factors related to the markets in general or to the implementation of any specific investment system cannot be fully accounted for in the preparation of simulated performance results and may adversely affect actual investment results.
To the extent permitted by law, R&I and its employees, agents and authorised representatives exclude all liability for any loss or damage (including indirect, special or consequential loss or damage) arising from the use of, or reliance on, any information offered by R&I whether or not caused by any negligent act or omission.

Author: Colin Twiggs is a former investment banker with almost 40 years of experience in financial markets. He co-founded Incredible Charts and writes the popular Trading Diary and Patient Investor newsletters.
Using a top-down approach, Colin identifies key macro trends in the global economy before evaluating selected opportunities using a combination of fundamental and technical analysis.
Focusing on interest rates and financial market liquidity as primary drivers of the economic cycle, he warned of the 2008/2009 and 2020 bear markets well ahead of actual events.
He founded PVT Capital (AFSL No. 546090) in May 2023, which offers investment strategy and advice to wholesale clients.
