What a difference a week makes
By Colin Twiggs
July 6th, 2014 11:00 a.m. AEST (9:00 p:m EDT)
Advice herein is provided for the general information of readers and does not have regard to any particular person's investment objectives, financial situation or needs. Accordingly, no reader should act on the basis of any information contained herein without first having consulted a suitably qualified financial advisor.
Research & Investment: Performance update
ASX200 Prime Momentum strategy returned +27.60%* for the 12 months ended 30th June 2014, outperforming the benchmark ASX200 Accumulation Index by +10.17%.

The S&P 500 Prime Momentum strategy has been running eight months, since November 2013, and returned 13.41%* for the period, compared to 13.06% for the S&P 500 Total Return Index.
A sell-off of momentum stocks affected performance in April, but macroeconomic and volatility filters indicate low risk typical of a bull market and we maintain full exposure to equities.
* Results are unaudited and subject to revision.
S&P 500: What a difference a week makes
Summary:
- S&P 500 advances toward 2000.
- China respects primary support.
- ASX 200 rallies.
- Understanding momentum.
Market sentiment shifted significantly to the bull side after some solid employment numbers. There are still concerns about low interest rates across the US and other major economies, but these policies are likely to continue — with corporate earnings remaining buoyant — for the foreseeable future. And as Eddy Elfenbein observed: "...market corrections solely due to valuation are fairly rare. If the market's dropping, earnings usually are too."
The S&P 500 is advancing towards the psychological barrier of 2000. Weekly (13-week) Twiggs Money Flow recovered above its descending trendline and Daily (21-day) is trending higher, signaling medium-term buying pressure. Expect retracement at the 2000 level, but short duration or narrow consolidation would indicate continued buying pressure and another advance. Reversal below 1950 is unlikely, but would warn of a correction to the rising trendline.
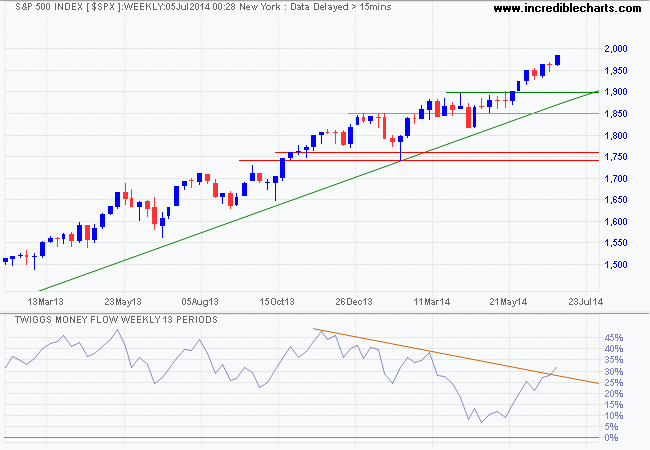
* Target calculation: 1900 + ( 1900 - 1800 ) = 2000
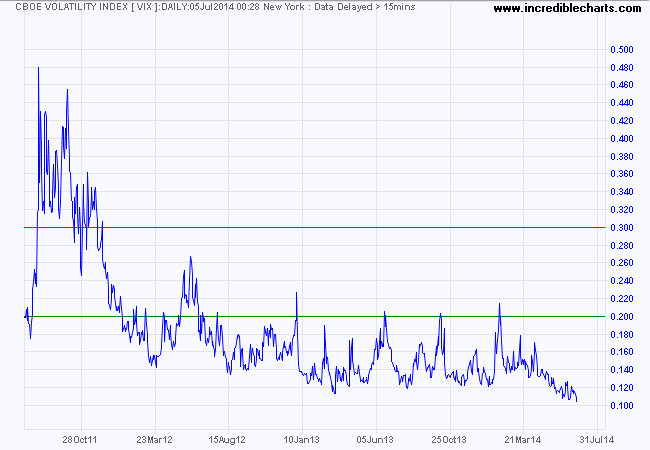
Buoyed by Fed monetary policy, CBOE Volatility Index (VIX) is at extremely low levels, indicative of a bull market.
The Shanghai Composite Index respected primary support at 1990/2000 and rising Twiggs Money Flow indicates medium-term buying pressure. Follow-through above 2080 would indicate another test of 2150. Further ranging between 2000 and 2150 is expected — in line with a managed "soft landing". Breach of primary support is unlikely at present, but would signal a decline to 1850*.
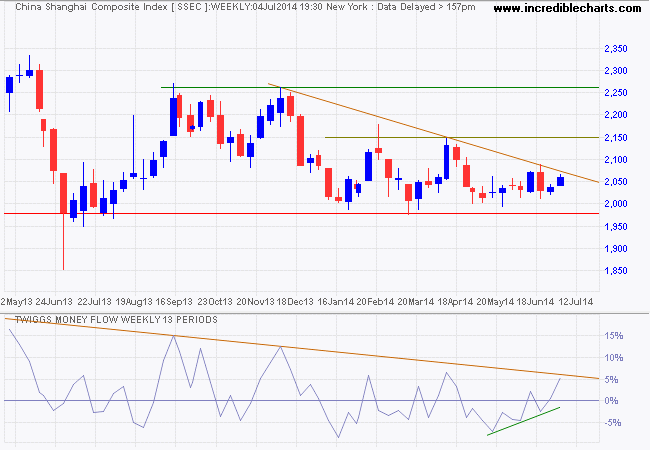
* Target calculation: 2000 - ( 2150 - 2000 ) = 1850
The ASX 200 is headed for another test of resistance at 5550 while an up-turn on 13-week Twiggs Money Flow suggests medium-term buying pressure. Twiggs Money Flow has been descending for some time, indicating long-term selling pressure, but failure to breach the zero line suggests buying support and completion of another trough above zero — with a rise above 20% — would confirm the resumption of long-term buying pressure. Breakout above 5550 would offer a long-term target of 5850*. Reversal below support at 5350 is unlikely, but would warn of a down-trend.
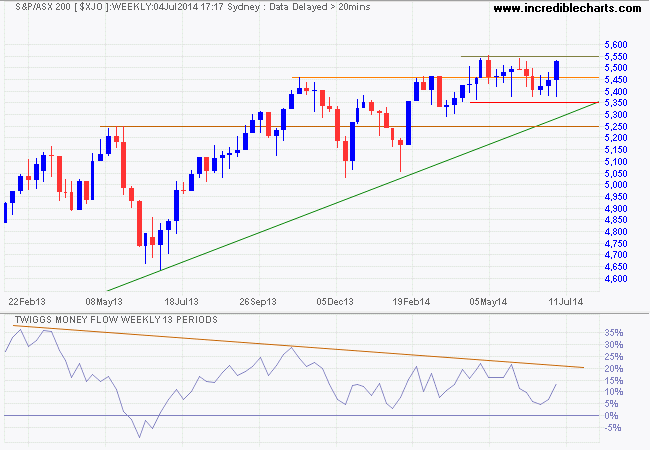
* Target calculation: 5400 + ( 5400 - 5000 ) = 5800
Understanding Momentum
Since its initial discovery by DeBondt & Thaler in 1985, the momentum effect has been documented and researched in many markets worldwide. Stocks which have outperformed in the recent past tend to continue to perform strongly over the months ahead.
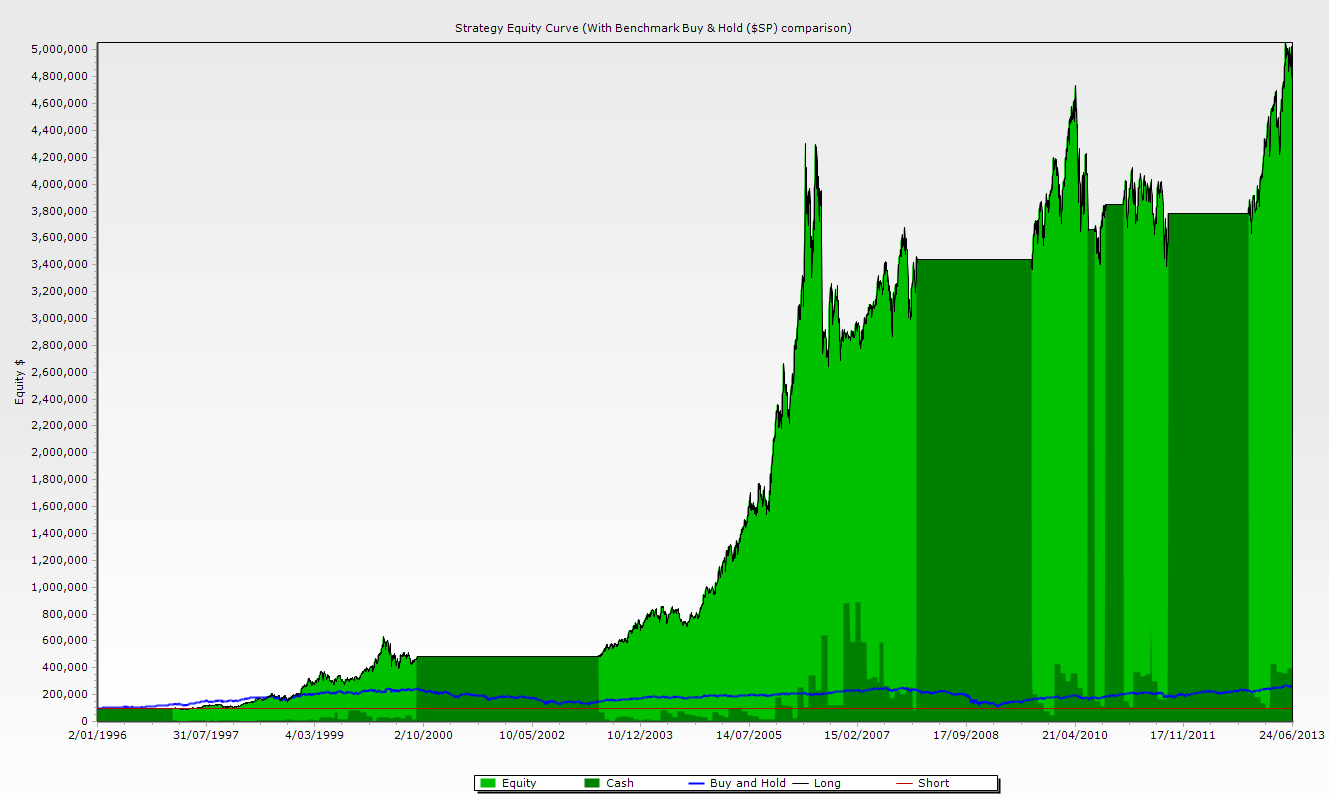
Research conducted by Dr Bruce Vanstone and me indicates that Momentum significantly outperforms the major benchmark indices in both US and Australian markets. Investors, however, tend to focus on the annual rate of return without considering the accompanying volatility. Consider our simulation of Twiggs Momentum on the S&P 500 for the period January 1996 to June 2013 as an example.
Dark green areas represent cash holdings, when market risk is identified as elevated. The blue line represents the benchmark S&P 500 index. Click on the image if you need a larger view.
| Investment Strategy: | Twiggs Momentum | Buy & Hold |
|---|---|---|
| Starting Capital (USD): | $100,000 | $100,000 |
| Ending Capital (USD): | $4,871,686.27 | $258,649.35 |
| Annualized Gain: | 24.89% | 5.58% |
| Total Commission Paid (at 5 BPS): | $66,194.35 | $49.96 |
| Number of Investments: | 331 | 1 |
| Win Rate: | 54.38% | 100.00% |
| Average Profit: | 44.16% | 158.79% |
| Average Loss: | 10.15% | 0.00% |
| Maximum Drawdown: | 38.64% | 56.77% |
| Maximum Drawdown Date: | 9/11/2006 | 3/9/2009 |
| Sharpe Ratio: | 0.98 | 0.42 |
Investors tend to focus on the annualized gain of 24.89% p.a. without really applying their minds to the other statistics in the table. Maximum Drawdown of 38.64%, while lower than the index, means the portfolio is still subject to gut-wrenching volatility. Soaring gains are often followed by sharp falls and it takes strong resolve to stick with the strategy after one of these setbacks. Many investors would have abandoned ship after the first major drawdown in early 2000.
Another factor is the Win Rate of just above 54% which means that over 45% of all stocks purchased are sold at a loss. These are typical statistics for a momentum strategy, but investors should expect a high percentage of stocks to be cut from the portfolio for failing to adhere to the expected growth path. The strength of the strategy, however, is the expected gains on stocks that do adhere to the momentum growth path, with average profits exceeding average losses by a ratio of almost 4 to 1. That is where the excess returns are generated and is the reason why the strategy outperforms the benchmark index.
There are also extended periods when the portfolio remains in cash — long enough for doubts to grow as to whether momentum still works in the markets. My own view is that momentum strategies have been shown to outperform the Dow over the last 100 years and are likely to remain viable for as long as we have stock market cycles.
Coping with the emotional roller-coaster ride of investing in stocks is never easy, but here are some hints.
- Focus on your investment time horizon of at least 5 years.
- Check stock prices no more than once a week. Tracking prices daily or more frequently tends to cloud your judgement.
- Welcome gains ahead of long-term averages, but expect them to fade over time.
- If something unusual occurs, step back from the market, examine the long-term history, and ask: "Is this really unexpected or were my expectations unrealistic."
That's all for today. Take care.
"You know," said Arthur, "it's at times like this, when I'm trapped in a Vogon airlock with a man from Betelgeuse, and about to die of asphyxiation in deep space that I really wish I'd listened to what my mother told me when I was young."
"Why, what did she tell you?"
"I don't know, I didn't listen."
~ Douglas Adams, The Ultimate Hitchhiker's Guide to the Galaxy
Disclaimer
Research & Investment Pty Ltd is a Corporate Authorized Representative (AR Number 384 397) of Andika Pty Ltd which holds an Australian Financial Services Licence (AFSL 297069).
The information on this web site and in the newsletters is general in nature and does not consider your personal circumstances. Please contact your professional financial adviser for advice tailored to your needs.
Research & Investment Pty Ltd ("R&I") has made every effort to ensure the reliability of the views and recommendations expressed in the reports published on its websites and newsletters. Our research is based upon information known to us or which was obtained from sources which we believe to be reliable and accurate.
No guarantee as to the capital value of investments, nor future returns are made by R&I. Neither R&I nor its employees make any representation, warranty or guarantee that the information provided is complete, accurate, current or reliable.
You are under no obligation to use these services and should always compare financial services/products to find one which best meets your personal objectives, financial situation or needs.
To the extent permitted by law, R&I and its employees, agents and authorised representatives exclude all liability for any loss or damage (including indirect, special or consequential loss or damage) arising from the use of, or reliance on, any information. If the law prohibits the exclusion of such liability, such liability shall be limited, to the extent permitted by law, to the resupply of the said information or the cost of the said resupply.
Important Warning About Simulated Results
Research & Investment (R&I) specialise in developing, testing and researching investment strategies and systems. Within the R&I web site and newsletters, you will find information about investment strategies and their performance. It is important that you understand that results from R&I research are simulated and not actual results.
No representation is made that any investor will or is likely to achieve profits or losses similar to those shown.
Simulated performance results are generally prepared with the benefit of hindsight and do not involve financial risk. No modeling can completely account for the impact of financial risk in actual investment. Account size, brokerage and slippage may also diverge from simulated results. Numerous other factors related to the markets in general or to the implementation of any specific investment system cannot be fully accounted for in the preparation of simulated performance results and may adversely affect actual investment results.
To the extent permitted by law, R&I and its employees, agents and authorised representatives exclude all liability for any loss or damage (including indirect, special or consequential loss or damage) arising from the use of, or reliance on, any information offered by R&I whether or not caused by any negligent act or omission.

Author: Colin Twiggs is a former investment banker with almost 40 years of experience in financial markets. He co-founded Incredible Charts and writes the popular Trading Diary and Patient Investor newsletters.
Using a top-down approach, Colin identifies key macro trends in the global economy before evaluating selected opportunities using a combination of fundamental and technical analysis.
Focusing on interest rates and financial market liquidity as primary drivers of the economic cycle, he warned of the 2008/2009 and 2020 bear markets well ahead of actual events.
He founded PVT Capital (AFSL No. 546090) in May 2023, which offers investment strategy and advice to wholesale clients.

