S&P 500 unfazed
By Colin Twiggs
June 28th, 2014 10:00 a.m. AEST (8:00 p:m EDT)
Advice herein is provided for the general information of readers and does not have regard to any particular person's investment objectives, financial situation or needs. Accordingly, no reader should act on the basis of any information contained herein without first having consulted a suitably qualified financial advisor.
Summary:
- S&P 500 continues a primary advance.
- China respects primary support.
- ASX 200 continues to signal weakness.
- Momentum investors need to hold positions.
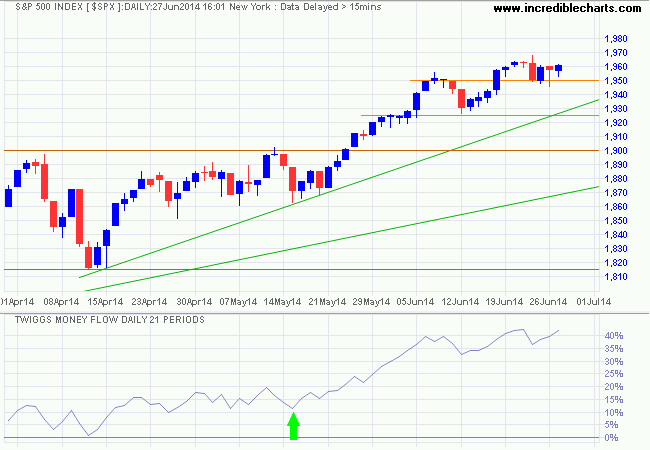
The S&P 500 retraced to test its latest support level at 1950 after a downward GDP revision for the first quarter. Respect indicates medium-term buying pressure — also evidenced by rising 21-day Twiggs Money Flow. Follow-through above 1970 would confirm a test of 2000*. Reversal below 1950 is unlikely, but penetration of the secondary trendline would warn of a correction.

* Target calculation: 1900 + ( 1900 - 1800 ) = 2000
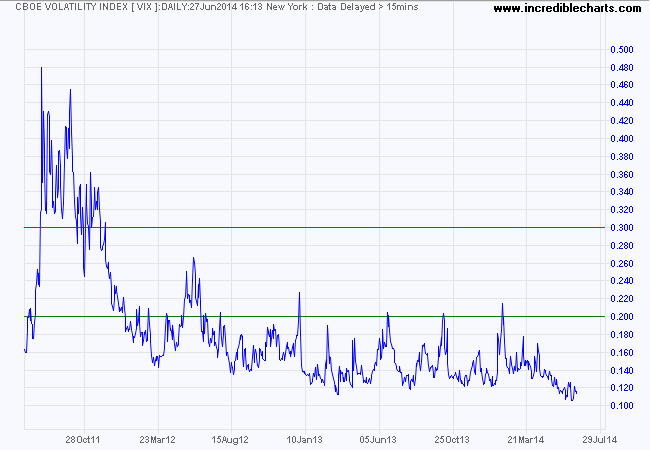
The CBOE Volatility Index (VIX) remains low, indicative of a bull market.

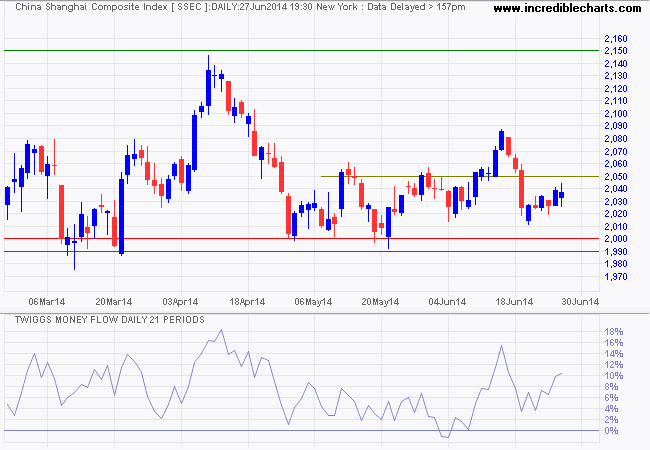
The Shanghai Composite Index respected primary support at 1990/2000. 21-Day Twiggs Money Flow oscillating above zero indicates buying support, but this may be due to the managed "soft landing". What we do know is that a fall below zero would definitely signal selling pressure. Breach of support would signal a decline to 1850*. The primary trend is expected to continue its downward path, but further ranging between 2000 and 2150 is likely. An abrupt fall is a fairly remote possibility.

* Target calculation: 2000 - ( 2150 - 2000 ) = 1850
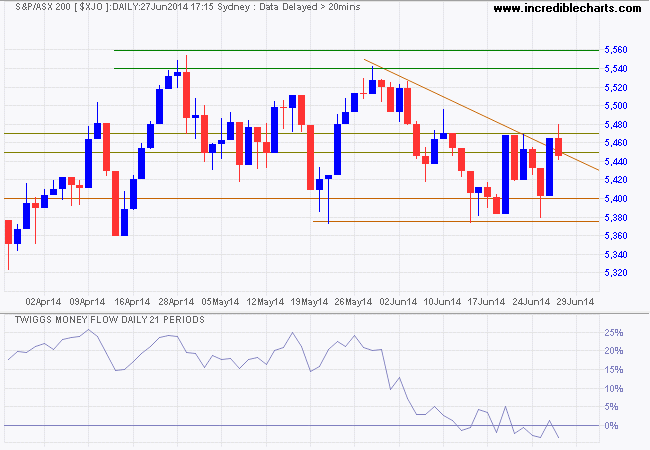
The ASX 200 made a false break above 5470, but 21-day Twiggs Money Flow below zero warns of medium-term selling pressure. Breach of support remains likely and would indicate a correction to 5300. The long-term trend, however, remains upward. Support at 5300/5400 would offer a great entry point for long-term investors. Recovery above 5470 is unlikely at present, but would signal a test of resistance at 5550.

* Target calculation: 5400 + ( 5400 - 5000 ) = 5800
I repeat my warning from last week: Momentum investors should not attempt to time secondary corrections and need to endure the present volatility in order to reach their intended investment goals.
How does R&I stack up against other investment channels?
DIY investors have several alternative channels for investing in equities. The most hands-off is is to invest in managed funds, or a managed discretionary account (MDA), where all investment decisions and actions are made for you. On the other extreme is to purchase investment software that offers a proven investment strategy, where you are responsible for your own investment decisions and execution. In the middle-ground is Research & Investment, where no decision-making is required — other than to invest in a subscription — but you are required to execute your own trades in the market.
Here we compare the relative costs and effort required for each investment channel using a standard investment of $100,000:
| Investment Alternative: | R&I | MDA | Software |
|---|---|---|---|
| Upfront cost: | $0 | $0 | $2,000 to $3,000 |
| Ongoing monthly cost: | $95 | $100 to $200 | $50 to $100 |
| Performance fees (above index benchmark): | None | Up to 22% | None |
| Time & Effort required: | 2 to 3 hours/month | 0 to 1 hours/month | 2 to 3 hours/day |
| Complexity: | Low | Very Low | High |
| Mobility & Freedom of movement: | High | Very High | Low |
| Detachment & Freedom from emotional pressure and external influences: | Medium | High | Low |
| Investment Timeframe | 5 to 10 years | ||
| Recommended Leverage: | None | ||
| Typical Number of Stocks: | 10 to 20 | Varies | Varies |
| Tax Implications: | Suitable for lower tax vehicles such as super funds. | ||
| Subscriber Limit: | 500 to 1000 | Varies | Unlimited |
| Performance: | Medium to High | Low to High | Low to High |
Upfront costs are for purchase of investment software.
Monthly costs include R&I subscriptions, management and platform fees for MDAs (from 1.2% to 2.4% of net assets), and data costs for investment software.
Performance fees are calculated on outperformance above a suitable benchmark like the ASX 200 Accumulation Index.
Time required for R&I is to review the update and implement the portfolio changes, normally once a month. A managed account merely requires you to review performance. Investment software normally requires daily scans of the market, review of charts and placing trades with your broker.
Complexity with R&I is limited to reading the updates and placing trades with your broker. A managed account merely requires you to review performance. But investment software requires complex installation and mastery of the operating rules.
Mobility is a problem if you are on holiday or work away from home and need to access your system. R&I requires you to login once a month to receive updates and then place any trades with an online broker. A managed account requires no monthly intervention. Investment software normally requires daily access to the database on your computer to perform scans and daily access to an online broker.
Detachment is achieved if you have a managed account: someone else makes the decisions for you. R&I is a rules-based strategy and requires you to ignore external influences and adhere to the system, implementing all trades. Because of the level of involvement required with investment software, detachment is difficult and investors often stray from the prescribed rules.
Investment time frame is the same for all three vehicles.
Recommended leverage is zero because of volatility of returns.
Typical number of stocks is 10 to 20. R&I is a high conviction strategy, selecting a smaller number of stocks in order to achieve outperformance. Some funds and software follow a similar path, while some erode performance through over-diversification (di-worsification as Warren Buffett calls it).
Tax implications are the same: active strategies do not maximise capital gains tax concessions and require a low tax vehicle such as a SMSF.
Subscriber limits are enforced by R&I to protect performance: too many investors using the same system would affect entry/exit prices and erode returns. Some managed funds are closed or capped, but most are not.
Performance of all three investment alternatives is variable, but by pursuing a high conviction strategy and following a strict, rules-based approach, R&I investors are more likely to outperform the relevant index benchmarks.
We hope you find this comparison useful. To find out more:
- Visit our home page or FAQ;
- Open a support ticket; or
- Call 1300-850-951 (Australia) or +1-866-662-7542 (USA & Canada) on weekdays.
People who pride themselves on their "complexity" and deride others for being "simplistic" should realize that the truth is often not very complicated. What gets complex is evading the truth.
~ Thomas Sowell: Barbarians inside the Gates and Other Controversial Essaysc
Disclaimer
Research & Investment Pty Ltd is a Corporate Authorized Representative (AR Number 384 397) of Andika Pty Ltd which holds an Australian Financial Services Licence (AFSL 297069).
The information on this web site and in the newsletters is general in nature and does not consider your personal circumstances. Please contact your professional financial adviser for advice tailored to your needs.
Research & Investment Pty Ltd ("R&I") has made every effort to ensure the reliability of the views and recommendations expressed in the reports published on its websites and newsletters. Our research is based upon information known to us or which was obtained from sources which we believe to be reliable and accurate.
No guarantee as to the capital value of investments, nor future returns are made by R&I. Neither R&I nor its employees make any representation, warranty or guarantee that the information provided is complete, accurate, current or reliable.
You are under no obligation to use these services and should always compare financial services/products to find one which best meets your personal objectives, financial situation or needs.
To the extent permitted by law, R&I and its employees, agents and authorised representatives exclude all liability for any loss or damage (including indirect, special or consequential loss or damage) arising from the use of, or reliance on, any information. If the law prohibits the exclusion of such liability, such liability shall be limited, to the extent permitted by law, to the resupply of the said information or the cost of the said resupply.
Important Warning About Simulated Results
Research & Investment (R&I) specialise in developing, testing and researching investment strategies and systems. Within the R&I web site and newsletters, you will find information about investment strategies and their performance. It is important that you understand that results from R&I research are simulated and not actual results.
No representation is made that any investor will or is likely to achieve profits or losses similar to those shown.
Simulated performance results are generally prepared with the benefit of hindsight and do not involve financial risk. No modeling can completely account for the impact of financial risk in actual investment. Account size, brokerage and slippage may also diverge from simulated results. Numerous other factors related to the markets in general or to the implementation of any specific investment system cannot be fully accounted for in the preparation of simulated performance results and may adversely affect actual investment results.
To the extent permitted by law, R&I and its employees, agents and authorised representatives exclude all liability for any loss or damage (including indirect, special or consequential loss or damage) arising from the use of, or reliance on, any information offered by R&I whether or not caused by any negligent act or omission.

Author: Colin Twiggs is a former investment banker with almost 40 years of experience in financial markets. He co-founded Incredible Charts and writes the popular Trading Diary and Patient Investor newsletters.
Using a top-down approach, Colin identifies key macro trends in the global economy before evaluating selected opportunities using a combination of fundamental and technical analysis.
Focusing on interest rates and financial market liquidity as primary drivers of the economic cycle, he warned of the 2008/2009 and 2020 bear markets well ahead of actual events.
He founded PVT Capital (AFSL No. 546090) in May 2023, which offers investment strategy and advice to wholesale clients.
