S&P 500: Strong Ichimoku trend
By Colin Twiggs
June 16th, 2014 9:00 pm EDT (11:00 am AEST)
These extracts from my trading diary are for educational purposes. Any advice contained therein is provided for the general information of readers and does not have regard to any particular person's investment objectives, financial situation or needs and must not be construed as advice to buy, sell, hold or otherwise deal with any securities or other investments. Accordingly, no reader should act on the basis of any information contained therein without first having consulted a suitably qualified financial advisor. Full terms and conditions can be found at Terms of Use.
Today we take a look at long-term trend strength in North American markets using a great trend tool, Ichimoku Cloud, with weekly charts. Ichimoku is only available on the latest beta version of Incredible Charts (Help >> Upgrade To Latest Beta Version), but will soon be released with Incredible Charts 7.0.
Ichimoku offers a number of trend signals:
- The trend is upward when price is above the Cloud (and downward when price is below).
- A green cloud indicates an up-trend, while red indicates a down-trend.
- Long trades are taken when the blue line crosses above the red. In strong trends, blue may hold above red for extended periods.
The S&P 500 encountered resistance and is consolidating below its target of 1950*. The trend above a green cloud is further strengthened by the blue (Tenkan) holding above the red (Kijun) line for an extended period. Continuation of the up-trend is likely and breakout above 1950 would signal an advance to 2000.
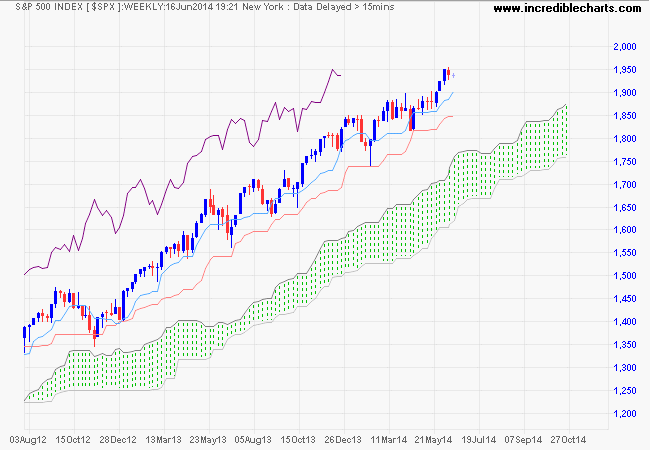
* Target calculation: 1850 + ( 1850 - 1750 ) = 1950
Dow Jones Industrial Average displays a similar strong trend with few blue (Tenkan) dips below the red (Kijun) line. Breakout above resistance at 17000 would signal an advance to 17500*. Reversal below 16500 is unlikely, but would warn of another correction.
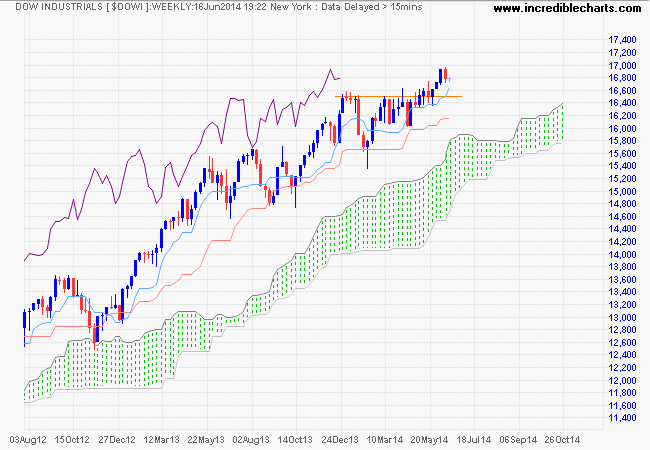
* Target calculation: 16500 + ( 16500 - 15500 ) = 17500
The Nasdaq 100 recovery of blue (Tenkan) above the red (Kijun) line offers a fresh entry signal. Resistance at 3800 is unlikely to hold and follow-through would confirm the target of 4000* for the advance. Reversal below 3700 is unlikely, but would warn of another correction.
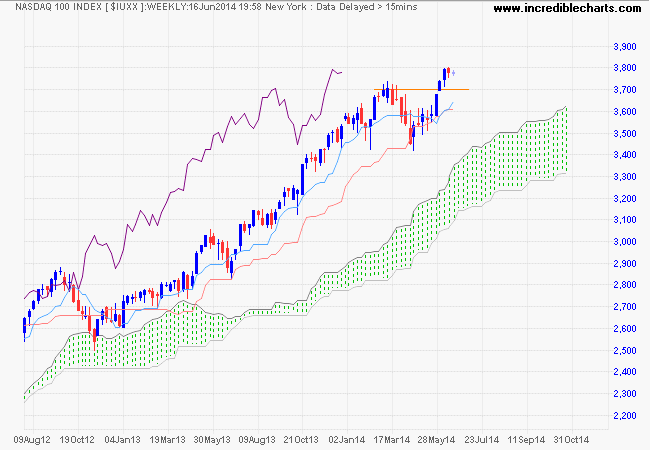
* Target calculation: 3700 + ( 3700 - 3400 ) = 4000
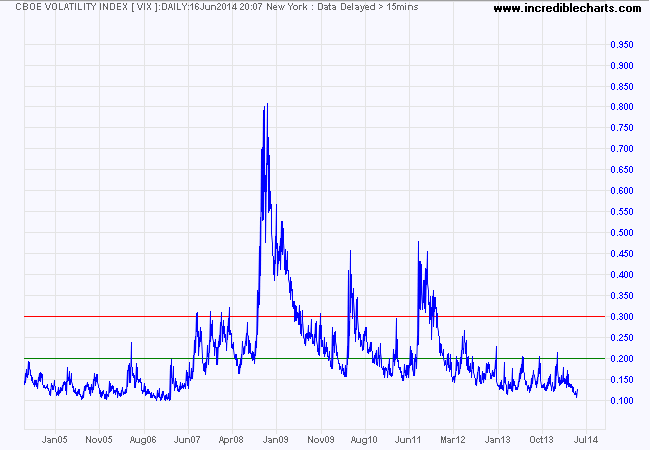
Another indication of trend strength is the CBOE Volatility Index (VIX), currently trading at levels last seen in 2005/2006, which indicates low risk typical of a bull market.
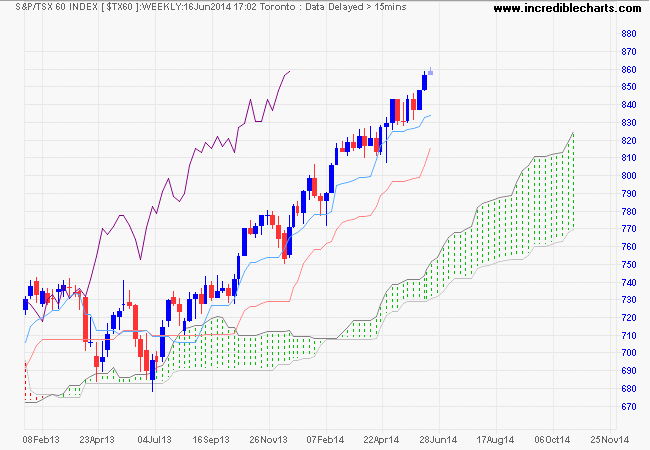
Canada's TSX 60 again shows a strong trend, trading high above a strong green cloud, with no recent crosses of blue (Tenkan) below the red (Kijun) line. Expect a test of the 2008 high at 900. Reversal below support at 830 is unlikely.
"Well this is a bull market, you know!"
He really meant to tell them that the big money was not in individual fluctuations but in the main movements — that is not in reading the tape but in sizing up the entire market and its trend.
~ Jesse Livermore

Author: Colin Twiggs is a former investment banker with almost 40 years of experience in financial markets. He co-founded Incredible Charts and writes the popular Trading Diary and Patient Investor newsletters.
Using a top-down approach, Colin identifies key macro trends in the global economy before evaluating selected opportunities using a combination of fundamental and technical analysis.
Focusing on interest rates and financial market liquidity as primary drivers of the economic cycle, he warned of the 2008/2009 and 2020 bear markets well ahead of actual events.
He founded PVT Capital (AFSL No. 546090) in May 2023, which offers investment strategy and advice to wholesale clients.
