S&P 500 bullish, Nasdaq tests resistance
By Colin Twiggs
June 3rd, 2014 5:30 am EDT (7:30 pm AEST)
These extracts from my trading diary are for educational purposes. Any advice contained therein is provided for the general information of readers and does not have regard to any particular person's investment objectives, financial situation or needs and must not be construed as advice to buy, sell, hold or otherwise deal with any securities or other investments. Accordingly, no reader should act on the basis of any information contained therein without first having consulted a suitably qualified financial advisor. Full terms and conditions can be found at Terms of Use.
Research & Investment: Performance update
Our ASX200 Prime Momentum strategy returned +28.56%* for the 12 months ended 31st May 2014, outperforming the benchmark ASX200 Accumulation Index by +12.11%.
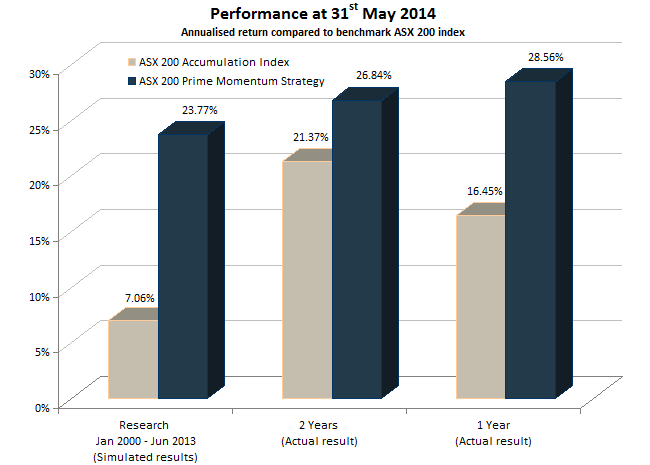
The S&P 500 Prime Momentum strategy has been running seven months, since November 2013, and returned 10.00%* for the period, compared to 10.77% for the S&P 500 Total Return Index.
A sell-off of momentum stocks affected performance in April, but macroeconomic and volatility filters indicate low risk typical of a bull market and we maintain full exposure to equities.
* Results are unaudited and subject to revision.
S&P 500
After early skittishness over some dud Institute for Supply Management (ISM) data, the S&P 500 recovered lost ground by the close. Expect an advance to 1950*. Rising 21-day Twiggs Money Flow troughs above zero indicate strong medium-term buying pressure. Reversal below 1900 is unlikely, but would warn of a correction.
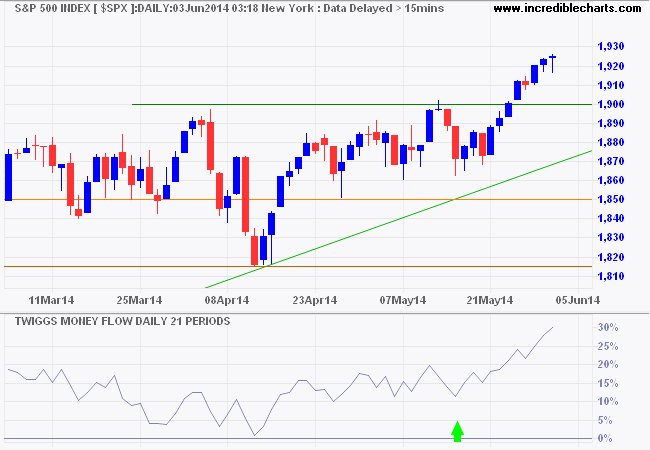
* Target calculation: 1850 + ( 1850 - 1750 ) = 1950
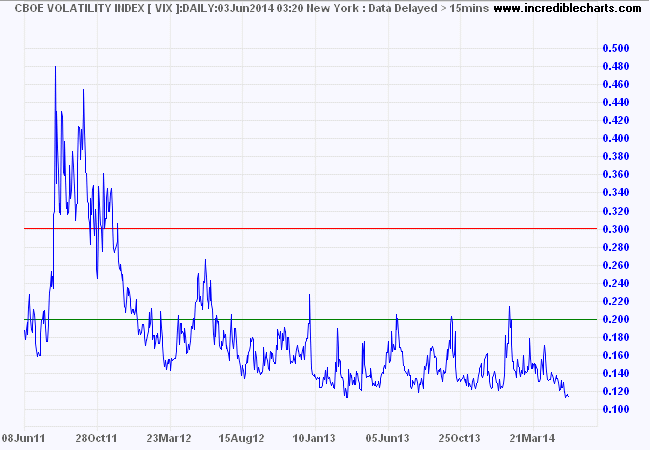
CBOE Volatility Index (VIX) below 12 indicates low risk typical of a bull market.
The Nasdaq 100 is testing resistance at 3740/3750. Breakout would signal an advance to 4000*. Rising 21-day Twiggs Money Flow troughs above zero again indicates strong medium-term buying pressure. Reversal below 3700, however, would warn of another correction.
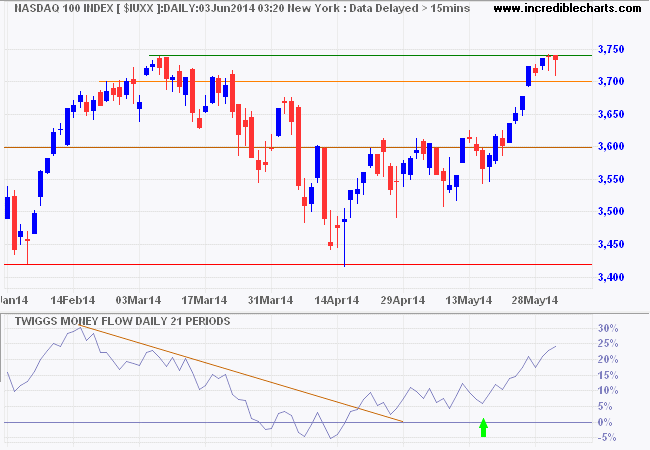
* Target calculation: 3700 + ( 3700 - 3400 ) = 4000
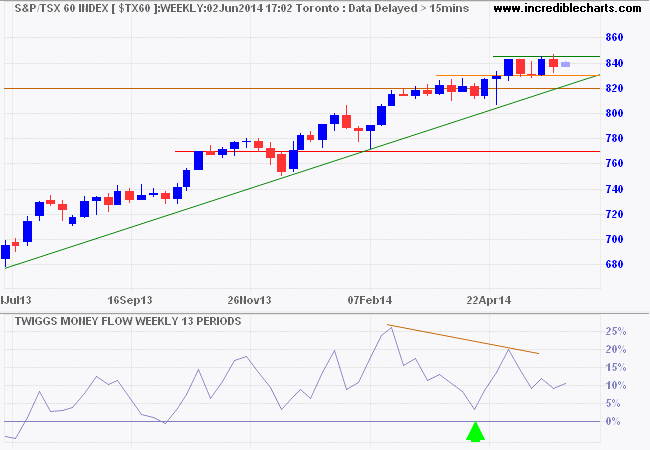
Canada's TSX 60 is consolidating in a narrow range on the weekly chart. Upward breakout is likely and would signal contuation of the advance to the 2008 high of 900. Bearish divergence on 13-week Twiggs Money Flow appears secondary, in line with the medium-term consolidation, but a further decline would warn of a correction. Reversal below support at 830 and the rising trendline is unlikely, but would indicate that the primary trend is slowing.
You may not control all the events that happen to you, but you can decide not to be reduced by them.
~ Maya Angelou, author and poet, died recently at age 86.

Author: Colin Twiggs is a former investment banker with almost 40 years of experience in financial markets. He co-founded Incredible Charts and writes the popular Trading Diary and Patient Investor newsletters.
Using a top-down approach, Colin identifies key macro trends in the global economy before evaluating selected opportunities using a combination of fundamental and technical analysis.
Focusing on interest rates and financial market liquidity as primary drivers of the economic cycle, he warned of the 2008/2009 and 2020 bear markets well ahead of actual events.
He founded PVT Capital (AFSL No. 546090) in May 2023, which offers investment strategy and advice to wholesale clients.
