Market sell-off despite improved job numbers
By Colin Twiggs
April 7th, 2014 3:00 am EDT (6:00 pm AEDT)
These extracts from my trading diary are for educational purposes. Any advice contained therein is provided for the general information of readers and does not have regard to any particular person's investment objectives, financial situation or needs and must not be construed as advice to buy, sell, hold or otherwise deal with any securities or other investments. Accordingly, no reader should act on the basis of any information contained therein without first having consulted a suitably qualified financial advisor. Full terms and conditions can be found at Terms of Use.
Research & Investment: Performance update
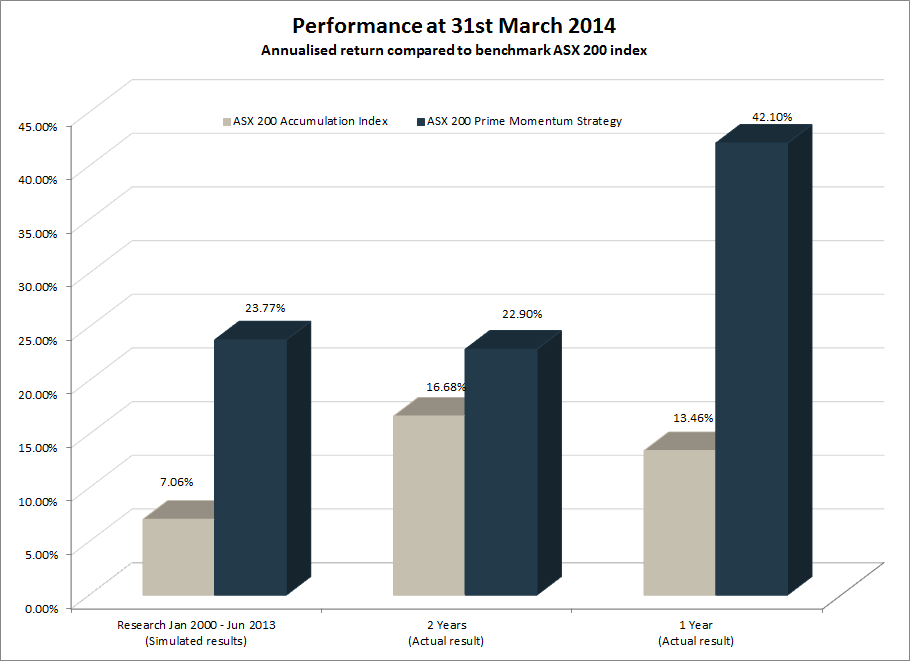
Our ASX200 Prime Momentum strategy returned +42.10%* for the 12 months ended 31st March 2014, outperforming the benchmark ASX200 Accumulation Index by +28.64%.
* Results are unaudited and subject to revision.

The S&P 500 Prime Momentum strategy has only been running five months, since November 2013, but returned 8.73%* for the period, compared to 6.28% for the S&P 500 Total Return Index.
S&P 500 breakout
The market experienced a strong sell-off Friday, despite signs that the Winter slowdown in job creation has ended. Nelson Schwartz at the New York Times writes:
The latest numbers are likely to be revised significantly as more information flows into the Bureau of Labor Statistics. Even so, they suggest that the economy is not achieving what economists call escape velocity, something that policy makers have long sought. Neither is it falling into the rut some pessimists feared was developing early in 2014.
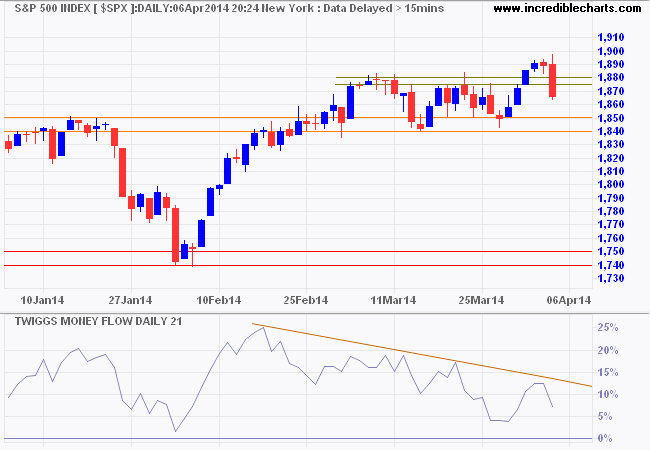
The S&P 500 retreated below its latest support level of 1880. Follow-through below 1840 would signal a correction, while respect of support would suggest an advance to 1950*. Bearish divergence on 21-day Twiggs Money Flow continues to warn of medium-term selling pressure and reversal below zero would strengthen the signal. An early correction (without a decent advance above the January high) would be a bearish sign, indicating that long-term sellers outnumber buyers.

* Target calculation: 1850 + ( 1850 - 1750 ) = 1950
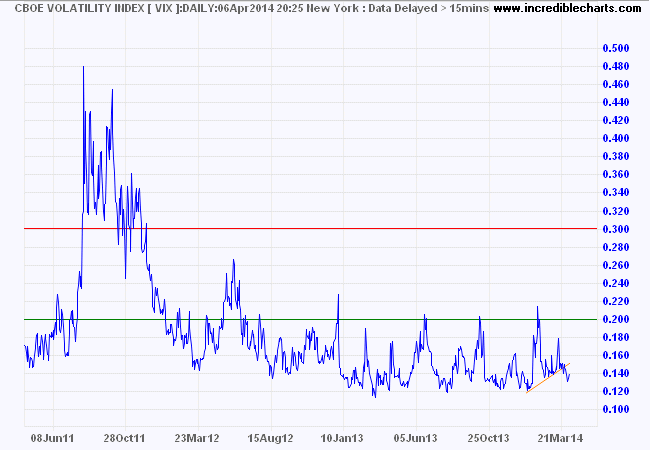
CBOE Volatility Index (VIX) at 14 continues to indicate low risk typical of a bull market.

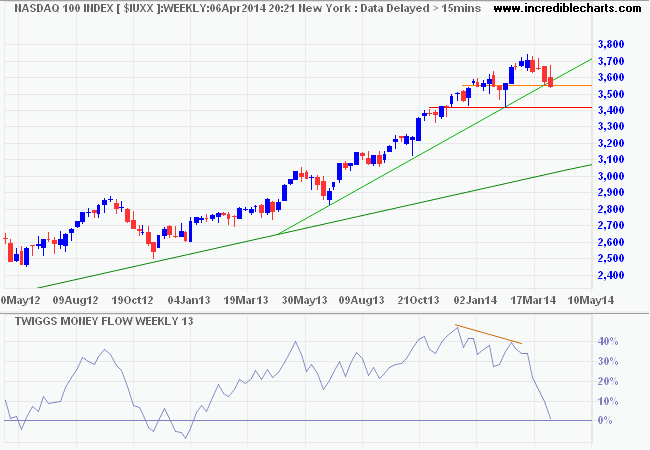
The Nasdaq 100 indicates long-term selling pressure, with a sharp fall following bearish divergence on 13-week Twiggs Money Flow. Breach of the (secondary) rising trendline and support at 3550 warns of a correction to primary support at 3400. Recovery above 3650 is unlikely, but would suggest a bear trap.

* Target calculation: 3750 + ( 3750 - 3550 ) = 3950
The primary trend remains upward and none of our market filters indicate signs of stress.
Every strike brings me closer to the next home run.
~ Babe Ruth

Author: Colin Twiggs is a former investment banker with almost 40 years of experience in financial markets. He co-founded Incredible Charts and writes the popular Trading Diary and Patient Investor newsletters.
Using a top-down approach, Colin identifies key macro trends in the global economy before evaluating selected opportunities using a combination of fundamental and technical analysis.
Focusing on interest rates and financial market liquidity as primary drivers of the economic cycle, he warned of the 2008/2009 and 2020 bear markets well ahead of actual events.
He founded PVT Capital (AFSL No. 546090) in May 2023, which offers investment strategy and advice to wholesale clients.
