Beware of the CAPE
By Colin Twiggs
January 26th, 2013 4:00 p.m. ET (8:00 a:m AEDT)
These extracts from my trading diary are for educational purposes. Any advice contained therein is provided for the general information of readers and does not have regard to any particular person's investment objectives, financial situation or needs and must not be construed as advice to buy, sell, hold or otherwise deal with any securities or other investments. Accordingly, no reader should act on the basis of any information contained therein without first having consulted a suitably qualified financial advisor. Full terms and conditions can be found at Terms of Use.
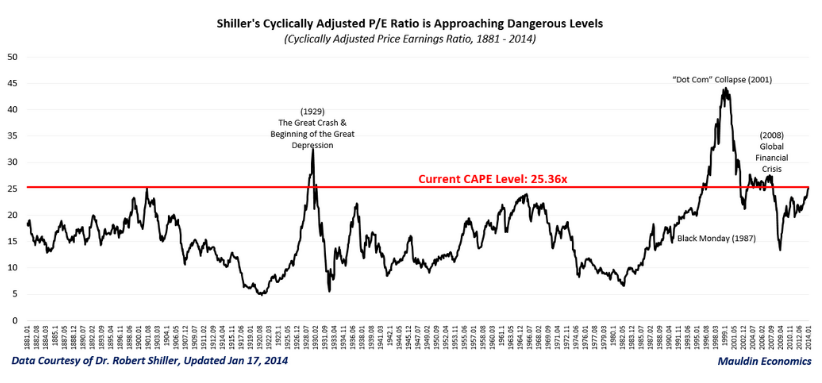
I have just read John Mauldin's warning that the market is overvalued:
Not only does today's CAPE of 25.4x suggest a seriously overvalued market, but the rapid multiple expansion of the last few years coupled with sluggish earnings growth suggests that this market is also seriously overbought, as I pointed out last week and as we are seeing play out this week.

Robert Shiller's CAPE ratio compares the current index price to a 10-year simple moving average of inflation-adjusted earnings in order to smooth out earnings and provide a long-term indication as to whether the market is under- or over-valued. But ratios are far from infallible. One of the first things fundamental investors/traders learn is: do not buy a stock simply because the Price-to-Earnings (PE) ratio is low, and never short a stock simply because the PE ratio is high. The reason is fairly obvious. In the first case, current earnings may be expected to fall and, with high PE ratios, earnings are likely to grow.
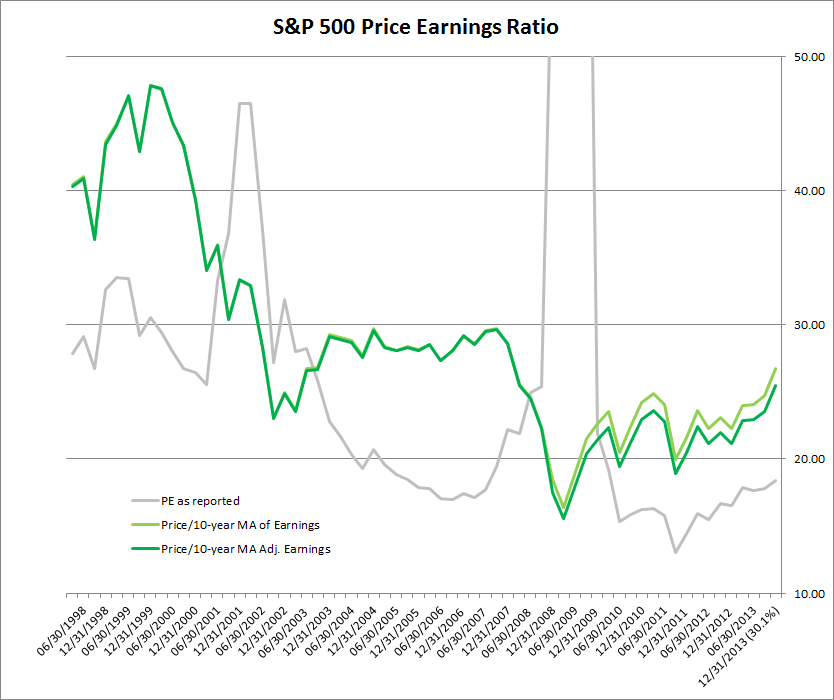
Let's examine CAPE more closely. First, we have experienced the worst recession in almost a century; so does a moving average of the last 10 years adequately reflect sustainable long-term earnings? In the chart below I removed the highest and lowest quarter's earnings in the last 10 years [dark green]. Note the visible difference losses reported in Q/E December 2008 make to the long-term average.

The chart also highlights the fact that Shiller's CAPE is relatively low compared to the last 15 years, where the average is close to 30. The normal PE of 18.4, calculated on the last 12-month's earnings*, is also low compared to an average of 28 for the last 15 years.
*Reporting for the December quarter is not yet completed and unreported earnings are based on S&P estimates.
As novice investors learn, it is dangerous to base buy or sell signals on a PE ratio, whether it is CAPE or regular PE based on 12-months earnings. Using CAPE, we would have sold stocks in 1996 and again in 2003, missing two of the biggest bull markets in history. And we would have most likely bought in 2008, when CAPE made a new 10-year low, right before the collapse of Lehmann Brothers.
I submit that CAPE or PE ratios are not an end in themselves, but merely a useful tool for highlighting expectations of future earnings. At present both ratios are rising, suggesting that earnings prospects are improving.
Once you learn to quit, it becomes a habit.
~ Vince Lombardi

Author: Colin Twiggs is a former investment banker with almost 40 years of experience in financial markets. He co-founded Incredible Charts and writes the popular Trading Diary and Patient Investor newsletters.
Using a top-down approach, Colin identifies key macro trends in the global economy before evaluating selected opportunities using a combination of fundamental and technical analysis.
Focusing on interest rates and financial market liquidity as primary drivers of the economic cycle, he warned of the 2008/2009 and 2020 bear markets well ahead of actual events.
He founded PVT Capital (AFSL No. 546090) in May 2023, which offers investment strategy and advice to wholesale clients.
