Bullish VIX readings for the S&P 500
By Colin Twiggs
January 15th, 2014 2:30 am ET (6:30 pm AEDT)
These extracts from my trading diary are for educational purposes. Any advice contained therein is provided for the general information of readers and does not have regard to any particular person's investment objectives, financial situation or needs and must not be construed as advice to buy, sell, hold or otherwise deal with any securities or other investments. Accordingly, no reader should act on the basis of any information contained therein without first having consulted a suitably qualified financial advisor. Full terms and conditions can be found at Terms of Use.
Research & Investment: 12 month performance
ASX200 Prime Momentum returned +32.88% for the 12 months ended 31st December, outperforming the ASX200 Accumulation Index by +12.58%. Comparable results for the S&P 500 are not yet available: the strategy only commenced in November 2013.
Bullish VIX readings for the S&P 500
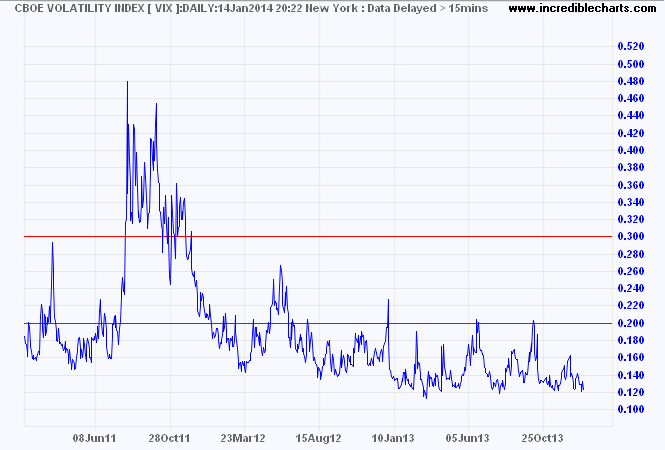
Declining CBOE Volatility Index (VIX) readings for the S&P 500 continue to indicate a bull market.

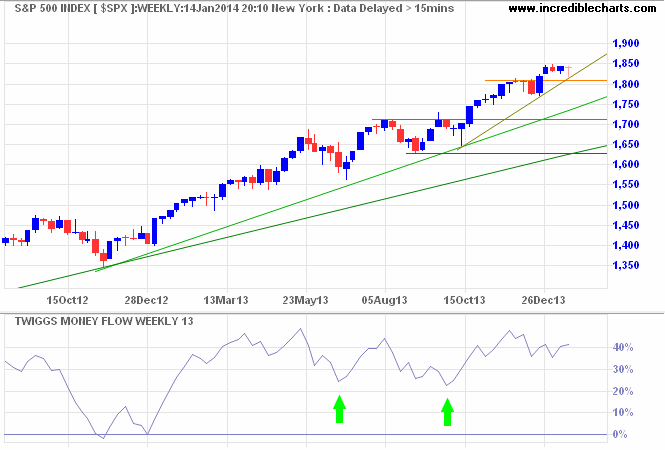
The S&P 500 itself is headed for another test of short-term resistance at 1850. Breakout would confirm the target of 1910*, while respect would warn of a correction, especially if followed by reversal below 1800. The recent decline in 13-week Twiggs Money Flow was secondary in nature and less severe than the corrections in June and August 2013; troughs high above the zero line are a long-term bull signal.

* Target calculation: 1810 + ( 1810 - 1710 ) = 1910
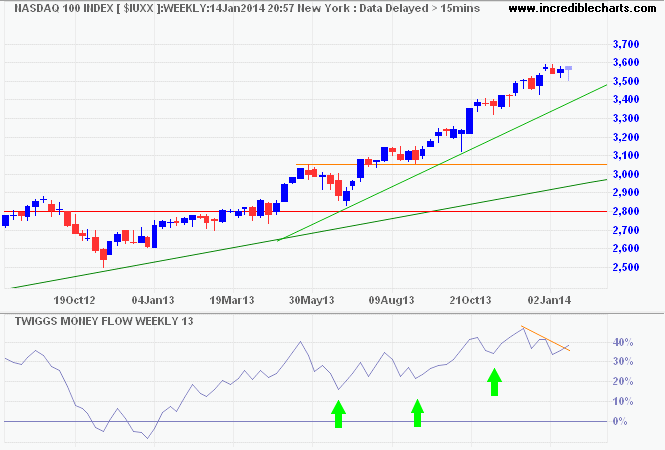
The Nasdaq 100 continues its accelerating up-trend, with Twiggs Money Flow troughs above the zero line indicating long-term buying pressure. The last decent correction was in June 2013 and continuation of the advance much further without a correction would suggest the market is becoming over-extended.

The only place success comes before work is in the dictionary.
~ Vince Lombardi

Author: Colin Twiggs is a former investment banker with almost 40 years of experience in financial markets. He co-founded Incredible Charts and writes the popular Trading Diary and Patient Investor newsletters.
Using a top-down approach, Colin identifies key macro trends in the global economy before evaluating selected opportunities using a combination of fundamental and technical analysis.
Focusing on interest rates and financial market liquidity as primary drivers of the economic cycle, he warned of the 2008/2009 and 2020 bear markets well ahead of actual events.
He founded PVT Capital (AFSL No. 546090) in May 2023, which offers investment strategy and advice to wholesale clients.
