Dollar falls and gold rises
By Colin Twiggs
October 24th, 2013 2:30 a.m. EDT (5:30 p:m AEDT)
These extracts from my trading diary are for educational purposes. Any advice contained therein is provided for the general information of readers and does not have regard to any particular person's investment objectives, financial situation or needs and must not be construed as advice to buy, sell, hold or otherwise deal with any securities or other investments. Accordingly, no reader should act on the basis of any information contained therein without first having consulted a suitably qualified financial advisor. Full terms and conditions can be found at Terms of Use.
The Dollar Index respected resistance at 80.50, breaking below 80 to confirm a primary decline. Breach of the 2012 lows at 79 would confirm a long-term target of 76.50*. The falling dollar is boosting gold prices.
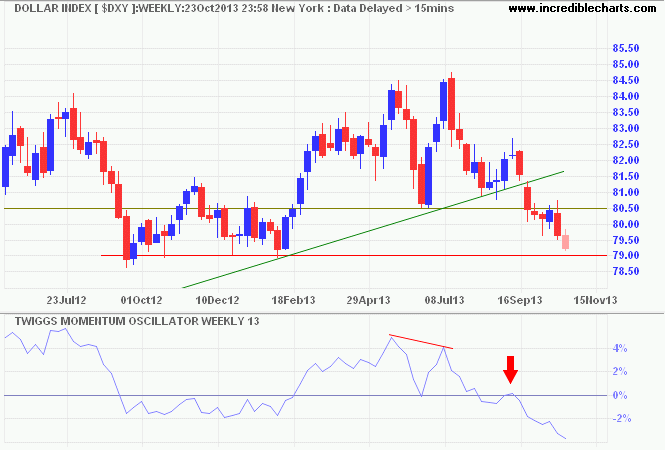
* Target calculation: 80.5 - ( 84.5 - 80.5 ) = 76.5
The yield on ten-year Treasury Notes broke through support at 2.60 percent, heading for primary support at 2.40 percent. Falling yields depress the dollar while lowering the opportunity cost of holding precious metals, exerting upward pressure on gold. Respect of primary support, however, would warn of an advance to 3.60 percent.
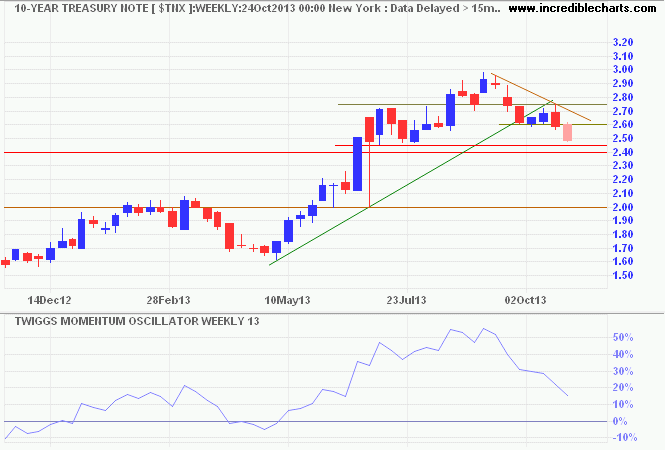
* Target calculation: 3.00 + ( 3.00 - 2.40 ) = 3.60
Gold
Spot gold recovered above $1300 and its descending trendline on the daily chart, suggesting another primary advance. Breakout above $1350 would confirm, offering a target of 1600*. Respect of resistance, however, would warn of another test of $1250.
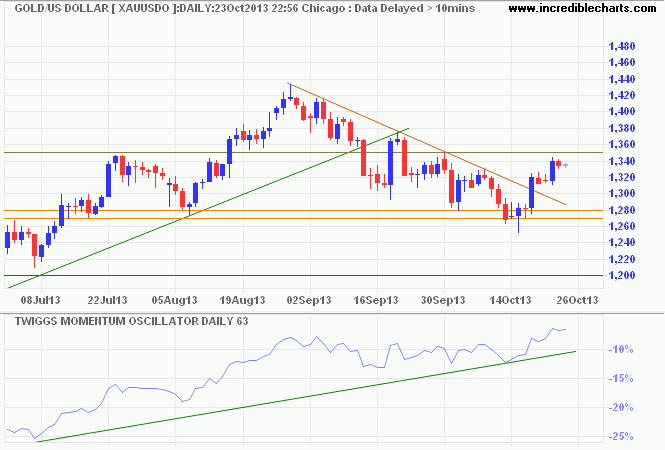
* Target calculation: 1425 + ( 1425 - 1250 ) = 1600
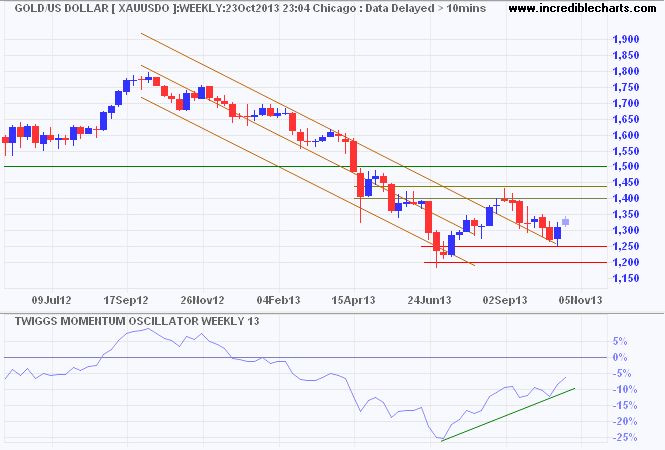
The weekly chart shows how penetration of the September high would signal a new primary up-trend. Strengthened if 13-week Twiggs Momentum crosses to above zero.
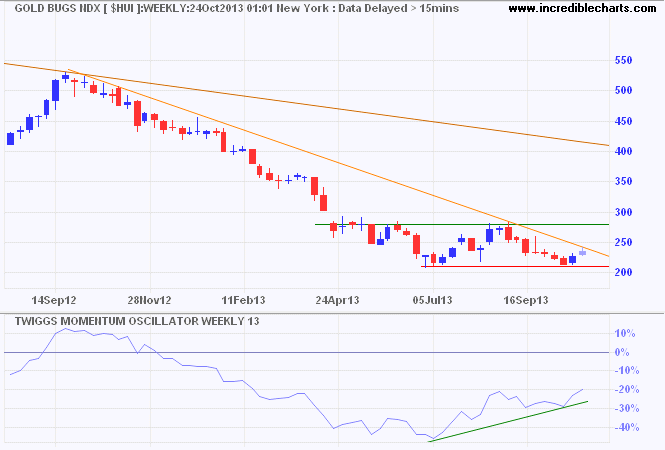
Bullish divergence of 13-week Twiggs Momentum on the Gold Bugs Index, representing un-hedged gold stocks, suggests a primary up-trend. Breakout above 280 would confirm.
Crude Oil
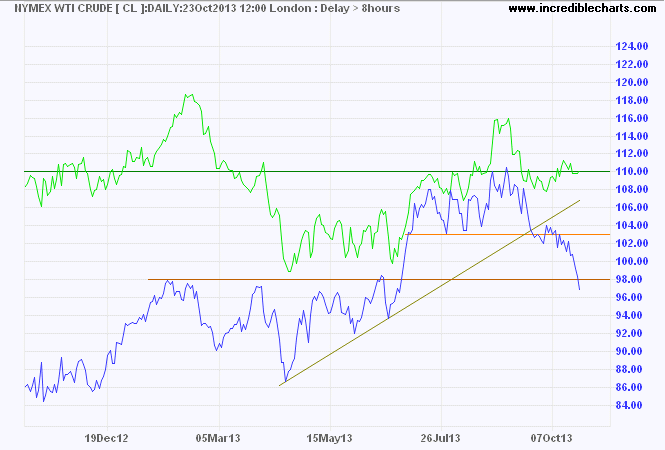
Nymex crude broke medium-term support at $98/barrel. Expect retracement to test the new resistance level, but respect would warn the primary up-trend is over. Divergence of Brent crude reflects both a strengthening European recovery and continued supply threats in the Middle East.
Commodity Prices
China's Shanghai Composite Index is testing medium-term support at 2150. Downward breakout would warn of another correction — a bearish sign for commodity prices. Dow Jones-UBS Commodity Index consolidation between 124 and 130 reflects indecision. Breakout will indicate future direction. A 13-week Twiggs Momentum peak below zero would warn of a continuing down-trend, while cross to above zero would suggest a reversal.
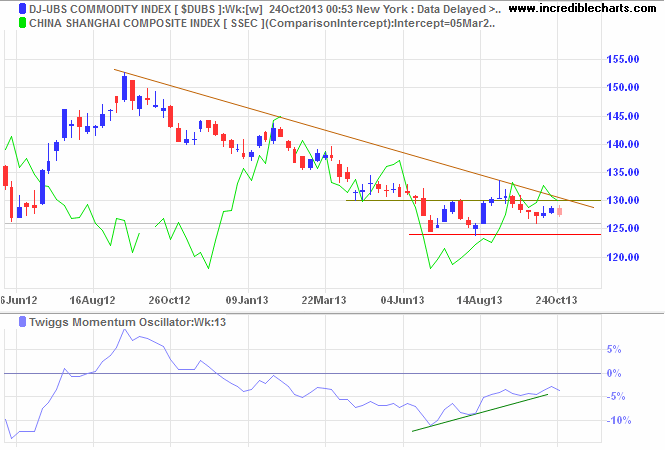
* Target calculation: 130 + ( 130 - 125 ) = 135
Intellect is not wisdom.
~ Thomas Sowell

Author: Colin Twiggs is a former investment banker with almost 40 years of experience in financial markets. He co-founded Incredible Charts and writes the popular Trading Diary and Patient Investor newsletters.
Using a top-down approach, Colin identifies key macro trends in the global economy before evaluating selected opportunities using a combination of fundamental and technical analysis.
Focusing on interest rates and financial market liquidity as primary drivers of the economic cycle, he warned of the 2008/2009 and 2020 bear markets well ahead of actual events.
He founded PVT Capital (AFSL No. 546090) in May 2023, which offers investment strategy and advice to wholesale clients.
