Gold consolidates as dollar and commodities fall
By Colin Twiggs
July 31st, 2013 8:30 p.m. EDT (10:30 a:m AET)
These extracts from my trading diary are for educational purposes. Any advice contained therein is provided for the general information of readers and does not have regard to any particular person's investment objectives, financial situation or needs and must not be construed as advice to buy, sell, hold or otherwise deal with any securities or other investments. Accordingly, no reader should act on the basis of any information contained therein without first having consulted a suitably qualified financial advisor. Full terms and conditions can be found at Terms of Use.
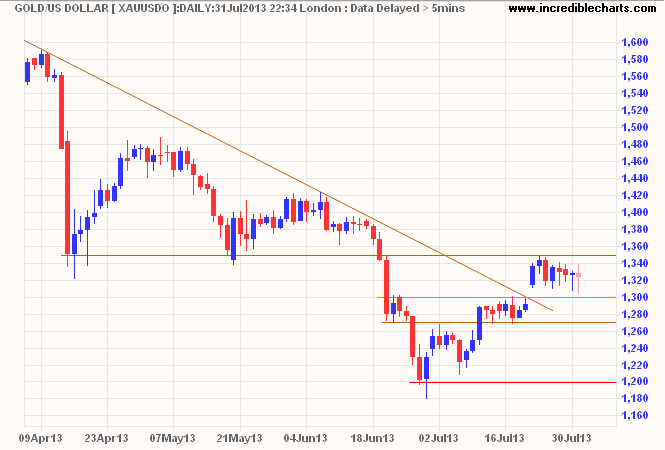
Gold is consolidating in a narrow range between $1300 and $1350/ounce. Penetration of the descending trendline indicates that a bottom is forming. Reversal below $1300 would suggest another test of primary support at $1200, but breakout above $1350 is as likely and would target $1400.
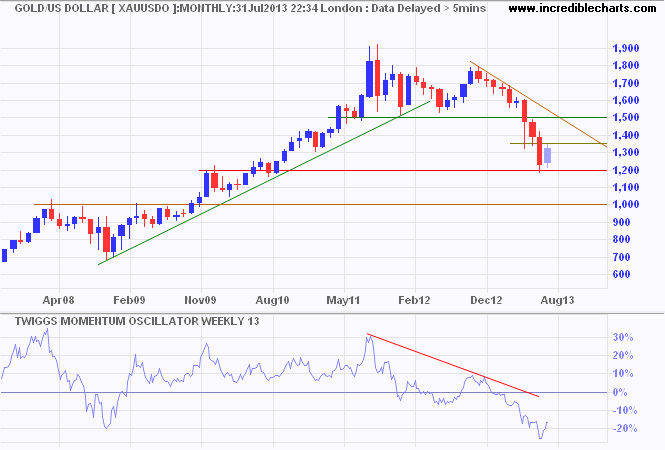
A rally to $1400 would test the long-term descending trendline as shown on the monthly chart.
Spot silver made a weaker rally over the last month and breakout below the rising flag would warn of another decline, with a target of $16.50*. Declining silver would be a bearish sign for gold.
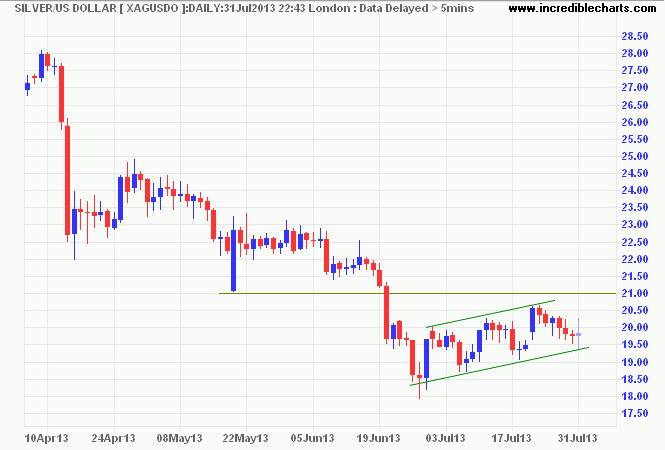
* Target calculation: 19.5 - ( 21.5 - 18.5 ) = 16.5
Dollar Index
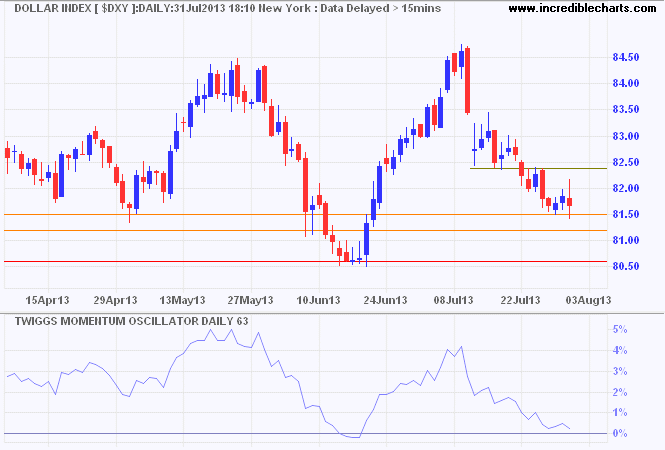
The Dollar Index found short-term support at 81.50. Penetration would indicate a test of primary support at 80.50. Recovery above 82.50 is unlikely, but would suggest the correction is over. Another 13-week Twiggs Momentum trough above zero would indicate the primary up-trend is intact. Breakout above 84.50 is some way off, but would signal an advance to the 2009/2010 highs around 90.00.
* Target calculation: 84 + ( 84 - 79 ) = 89
Crude Oil
Nymex WTI light crude is retracing after a sharp rally and is likely to find support between $98 and $100/barrel. Expect the spread with Brent crude to narrow as the US recovery outstrips Europe.
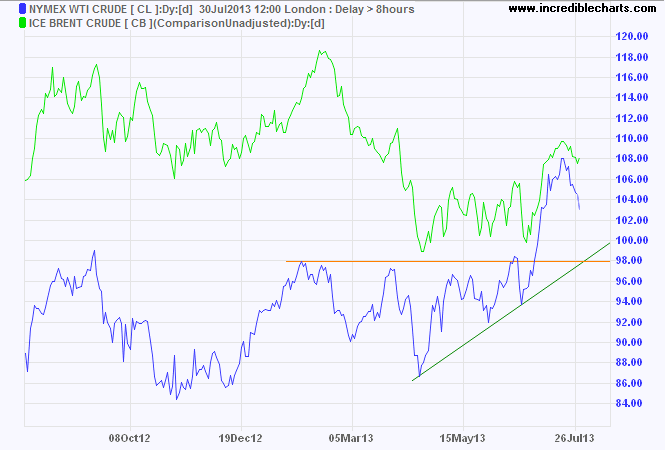
* Target calculation: 98 + ( 98 - 86 ) = 110
Commodities
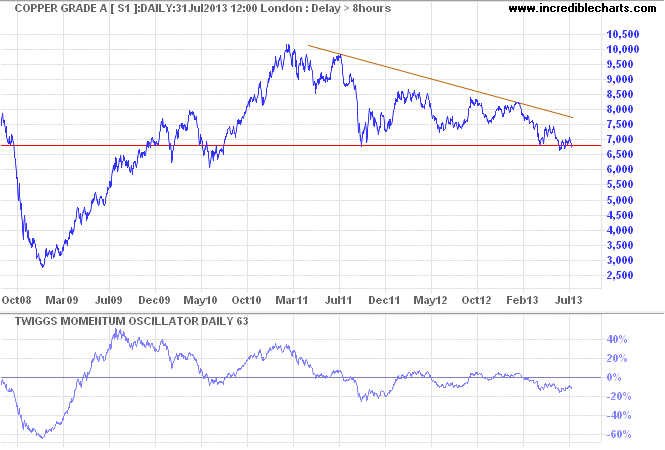
Copper is testing long-term support at $6800/ton. Follow-through below $6700 would confirm another primary decline.
Commodity prices are primarily driven by Chinese demand. With the Shanghai Composite Index testing its 2012 low (1950), breakout would signal a decline to its 2008 low (1660) and drag commodity prices lower. Dow Jones-UBS Commodity Index breach of long-term support at 125/126 would confirm, targeting its 2009 low at 100*. Not good news for Australian resources stocks, even if the impact is cushioned by a falling Aussie Dollar.
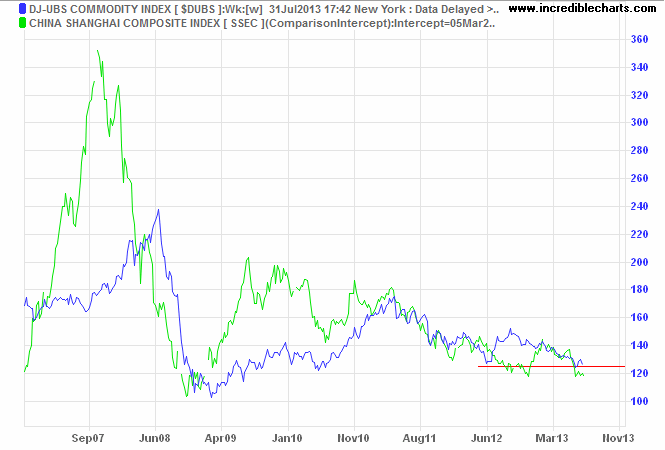
* Target calculation: 125 - ( 150 - 125 ) = 100
An old belief is like an old shoe. We so value its comfort that we fail to notice the hole in it.
~ Robert Brault

Author: Colin Twiggs is a former investment banker with almost 40 years of experience in financial markets. He co-founded Incredible Charts and writes the popular Trading Diary and Patient Investor newsletters.
Using a top-down approach, Colin identifies key macro trends in the global economy before evaluating selected opportunities using a combination of fundamental and technical analysis.
Focusing on interest rates and financial market liquidity as primary drivers of the economic cycle, he warned of the 2008/2009 and 2020 bear markets well ahead of actual events.
He founded PVT Capital (AFSL No. 546090) in May 2023, which offers investment strategy and advice to wholesale clients.
