Gold rally falters, while bond yields rise
By Colin Twiggs
May 9th, 2013 5:00 a.m. ET (7:00 p:m AET)
These extracts from my trading diary are for educational purposes. Any advice contained therein is provided for the general information of readers and does not have regard to any particular person's investment objectives, financial situation or needs and must not be construed as advice to buy, sell, hold or otherwise deal with any securities or other investments. Accordingly, no reader should act on the basis of any information contained therein without first having consulted a suitably qualified financial advisor. Full terms and conditions can be found at Terms of Use.
Gold's bear rally has run out of steam, with continued tests of support at $1440/$1450. Breach would penetrate the rising trendline, indicating another test of primary support at $1320. Target for the decline would be $1200*. Breakout above $1500 is unlikely, but would test $1550.
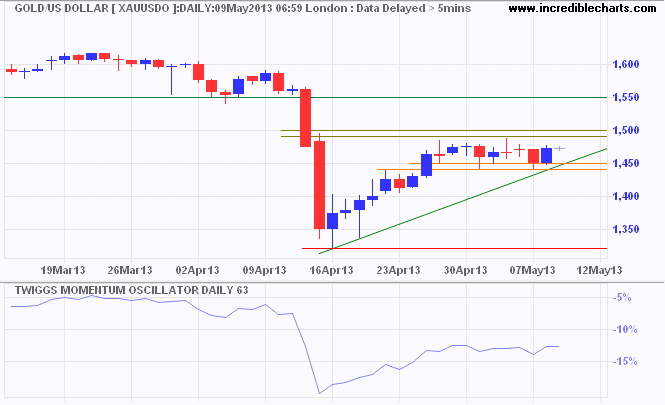
* Target calculation: 1350 - ( 1500 - 1350 ) = 1200
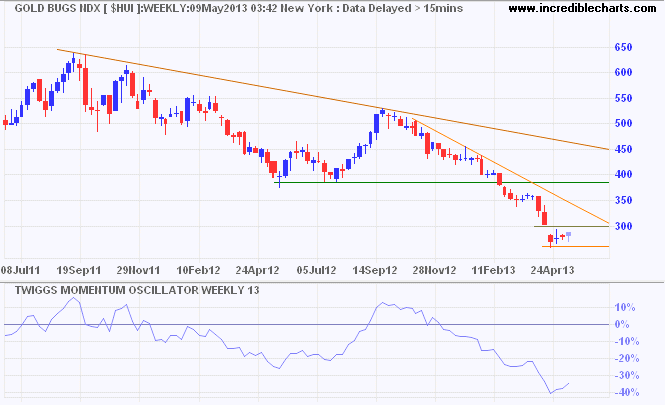
The Gold Bugs Index, representing un-hedged gold stocks, behaves like a leveraged gold instrument. So far there is no sign of a bounce. Breach of support at 260 would warn of another decline.
Treasury Yields
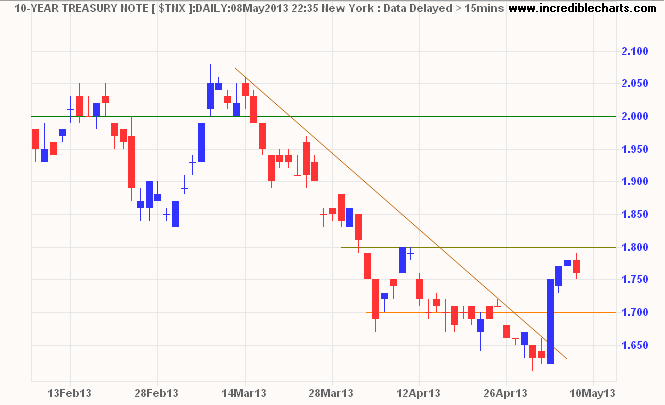
Ten-year treasury yields rallied sharply at the end of last week and are now testing resistance at 1.80%. Respect of resistance remains likely — after all this is a down-trend — and would suggest another test of the all-time low at 1.40%. Breakout above 1.80% would signal a test of resistance at 2.00/2.05%, while breach of that level would signal a primary up-trend. The thirty year secular bear trend (in yields) continues and would only be reversed by a rise above 4.00%.
Crude Oil
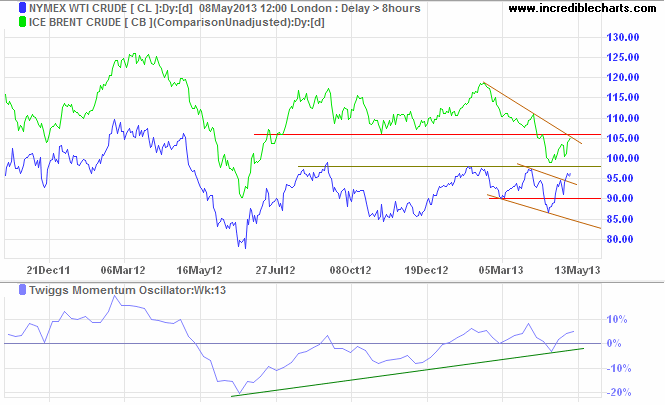
Brent Crude is testing its former support level at $106/barrel. Respect is likely and would offer a target of $92*. Nymex WTI broke out of its trend channel, but the trend remains downward until resistance at $98 is broken. A classic pair trade, the spread between the two is likely to narrow as the European economy under-performs.
Commodities
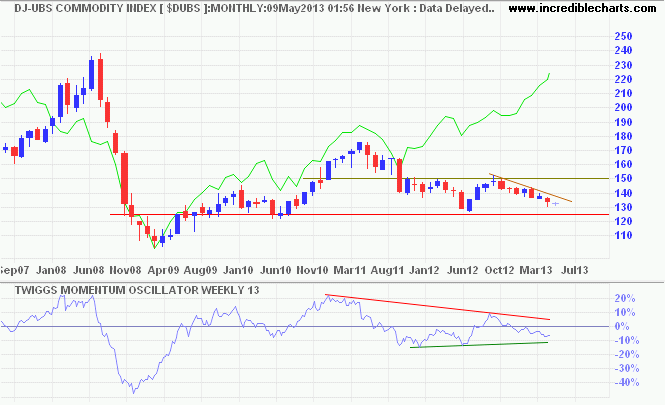
Commodity prices continue to diverge from stocks, with the S&P 500 advancing while Dow Jones - UBS Commodity Index is headed for primary support at 125.
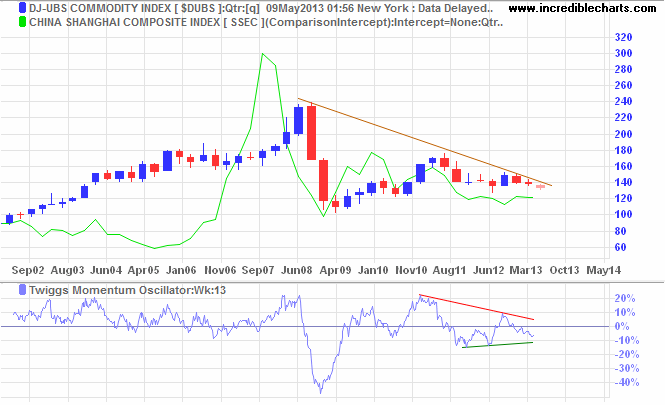
Reason for the disconnect is evident on the next chart. Demand from China has been driving commodities for most of the last decade. A slowing Chinese economy more than offset rising demand from the USA.
The habit of ubiquitous interventionism, combining pinprick strikes by precision weapons with pious invocations of high principle, would lead us into endless difficulties. Interventions must be limited in number and overwhelming in their impact.
~ Margaret Thatcher, Statecraft: Strategies for a Changing World (2002)

Author: Colin Twiggs is a former investment banker with almost 40 years of experience in financial markets. He co-founded Incredible Charts and writes the popular Trading Diary and Patient Investor newsletters.
Using a top-down approach, Colin identifies key macro trends in the global economy before evaluating selected opportunities using a combination of fundamental and technical analysis.
Focusing on interest rates and financial market liquidity as primary drivers of the economic cycle, he warned of the 2008/2009 and 2020 bear markets well ahead of actual events.
He founded PVT Capital (AFSL No. 546090) in May 2023, which offers investment strategy and advice to wholesale clients.
