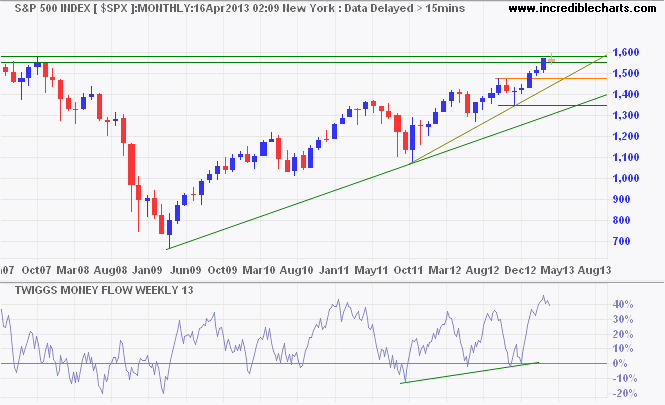
Dramatic fall on S&P 500
By Colin Twiggs
April 16th, 2013 4:00 a.m. ET (6:00 pm AET)
These extracts from my trading diary are for educational purposes. Any advice contained therein is provided for the general information of readers and does not have regard to any particular person's investment objectives, financial situation or needs and must not be construed as advice to buy, sell, hold or otherwise deal with any securities or other investments. Accordingly, no reader should act on the basis of any information contained therein without first having consulted a suitably qualified financial advisor. Full terms and conditions can be found at Terms of Use.
The S&P 500 fell 220 basis points (2.2%) on Monday, blamed variously on disappointing growth figures from China, the fall in gold, and the Boston Marathon tragedy. I still suspect that the primary cause is the tectonic shift last week by the Bank of Japan.
"Where is the fall?" you may ask, when viewing the chart below. That is what I enjoy about monthly charts: they place daily moves in perspective. Breach of support at 1540 would indicate a small secondary correction, while breakout below 1490 would signal a correction back to the primary trendline. But the primary trend remains up. Only a fall through 1350 would suggest a reversal.

Democratic nations must try to find ways to starve the terrorist and the hijacker of the oxygen of publicity on which they depend.
~ Margaret Thatcher

Author: Colin Twiggs is a former investment banker with almost 40 years of experience in financial markets. He co-founded Incredible Charts and writes the popular Trading Diary and Patient Investor newsletters.
Using a top-down approach, Colin identifies key macro trends in the global economy before evaluating selected opportunities using a combination of fundamental and technical analysis.
Focusing on interest rates and financial market liquidity as primary drivers of the economic cycle, he warned of the 2008/2009 and 2020 bear markets well ahead of actual events.
He founded PVT Capital (AFSL No. 546090) in May 2023, which offers investment strategy and advice to wholesale clients.
