S&P 500 and 10-year Treasury yields
By Colin Twiggs
April 4th, 2013 1:00 a.m. ET (4:00 pm AEDT)
These extracts from my trading diary are for educational purposes. Any advice contained therein is provided for the general information of readers and does not have regard to any particular person's investment objectives, financial situation or needs and must not be construed as advice to buy, sell, hold or otherwise deal with any securities or other investments. Accordingly, no reader should act on the basis of any information contained therein without first having consulted a suitably qualified financial advisor. Full terms and conditions can be found at Terms of Use.
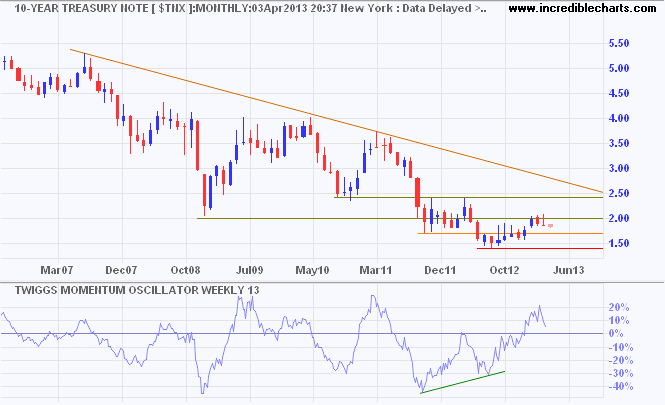
The yield on 10-year Treasury Notes retreated below 2.00%. Falling bond yields indicate the expected time horizon for low short-term interest rates is lengthening — a negative reflection on the economy.
The first line of support for $TNX is 1.70%; breach would signal another attempt at 1.40%. Bullish divergence on 13-week Twiggs Momentum indicates that a base is forming and primary support is unlikely to be broken.

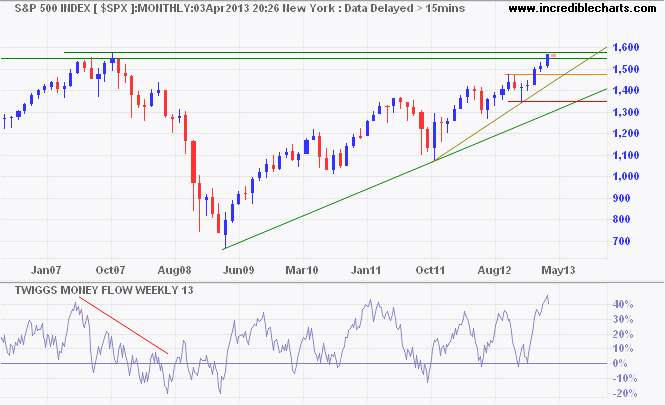
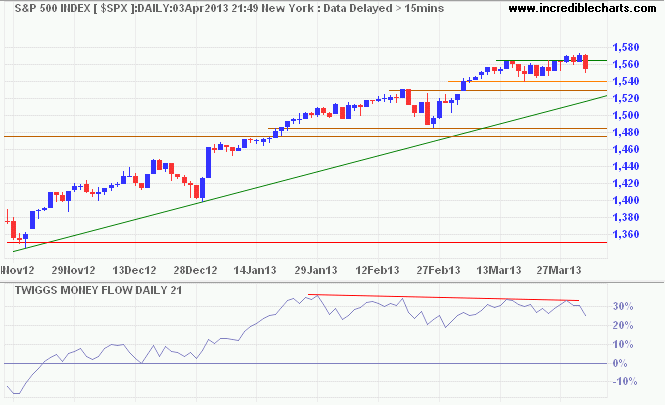
The S&P 500 retreated from its 2007 high at 1575.

* Target calculation: 1530 + ( 1530 - 1485 ) = 1575
Bearish divergence on 21-day Twiggs Money Flow continues to warn of mild selling pressure. Breach of support at 1530 — and the rising trendline — would warn of a correction.

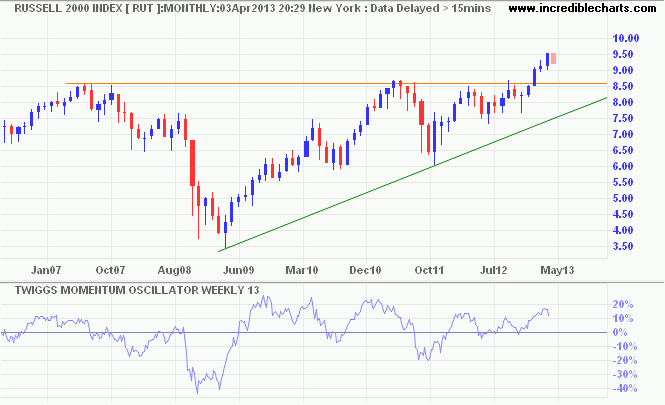
The Russell 2000 Index is stronger, having broken clear of its 2007 high at 860. A correction that respects the new support level (860) would confirm a strong primary up-trend.

While there are structural flaws in the US economy, QE from the Fed has forced investors to increase risk in search of yield. The current advance shows no signs of ending.
Men make history and not the other way around. In periods where there is no leadership, society stands still. Progress occurs when courageous, skillful leaders seize the opportunity to change things for the better.
~ Harry S. Truman

Author: Colin Twiggs is a former investment banker with almost 40 years of experience in financial markets. He co-founded Incredible Charts and writes the popular Trading Diary and Patient Investor newsletters.
Using a top-down approach, Colin identifies key macro trends in the global economy before evaluating selected opportunities using a combination of fundamental and technical analysis.
Focusing on interest rates and financial market liquidity as primary drivers of the economic cycle, he warned of the 2008/2009 and 2020 bear markets well ahead of actual events.
He founded PVT Capital (AFSL No. 546090) in May 2023, which offers investment strategy and advice to wholesale clients.
