Gold tests $1550/ounce
By Colin Twiggs
March 7th, 2013 2:30 a.m. ET (6:30 p:m AET)
These extracts from my trading diary are for educational purposes. Any advice contained therein is provided for the general information of readers and does not have regard to any particular person's investment objectives, financial situation or needs and must not be construed as advice to buy, sell, hold or otherwise deal with any securities or other investments. Accordingly, no reader should act on the basis of any information contained therein without first having consulted a suitably qualified financial advisor. Full terms and conditions can be found at Terms of Use.
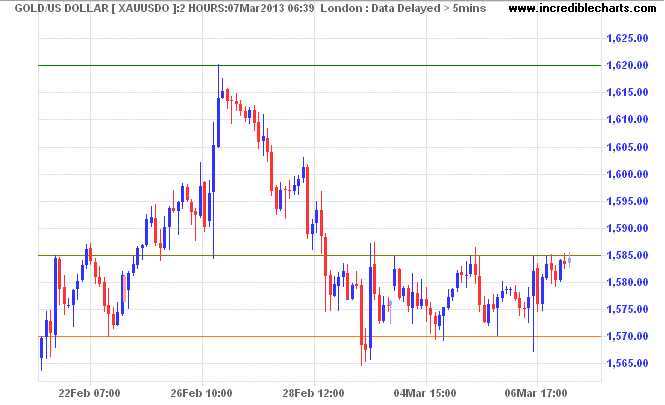
Spot gold is consolidating between $1570 and $1585/ounce on the 2-hourly chart. Upward breakout would re-test the February 26 high at $1620. Downward breakout would test support at $1550.

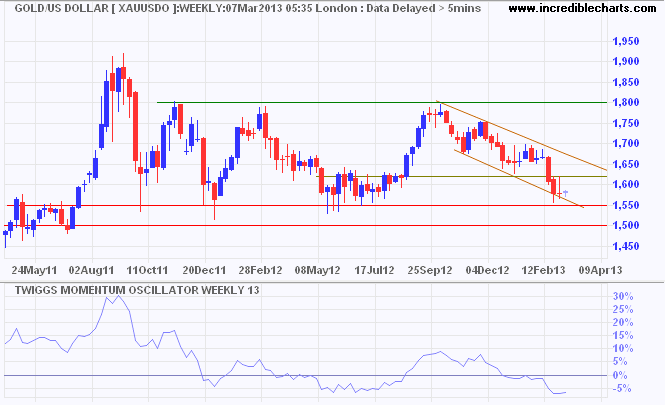
This can also be seen on the weekly chart, where respect of support at $1550 would test the upper trend channel at $1620. Breakout would indicate that the correction is over. Failure of support would warn that the long-term up-trend is over and follow-through below $1500 would confirm a primary down-trend.

My conclusion is the same as last week:
I am not yet convinced that gold is headed for a primary down-trend. We may be in a low-inflation/deflationary environment right now but how long will it take for central bank expansionary policies to overcome this? Watch out for bear traps. Respect of primary support around $1500 could present a buying opportunity.
Crude Oil
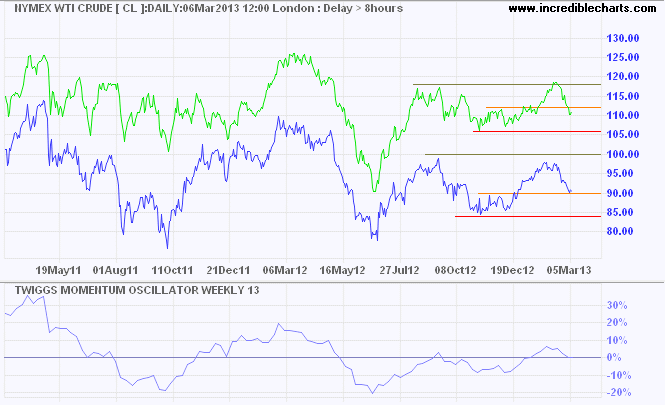
Brent Crude and Nymex Crude continue to weaken but, for the moment, remain in a primary up-trend.retreated below support at $117/barrel, on concerns over the global economy. Failure of primary support at $106 and $84/barrel, respectively, would signal a primary down-trend. Falling crude would be a bearish sign for gold: demand for gold increases when crude rises.

Not everything that counts can be counted, and not everything that can be counted counts.
~ Sign hanging in Albert Einstein's office at Princeton

Author: Colin Twiggs is a former investment banker with almost 40 years of experience in financial markets. He co-founded Incredible Charts and writes the popular Trading Diary and Patient Investor newsletters.
Using a top-down approach, Colin identifies key macro trends in the global economy before evaluating selected opportunities using a combination of fundamental and technical analysis.
Focusing on interest rates and financial market liquidity as primary drivers of the economic cycle, he warned of the 2008/2009 and 2020 bear markets well ahead of actual events.
He founded PVT Capital (AFSL No. 546090) in May 2023, which offers investment strategy and advice to wholesale clients.
