Gold falls sharply
By Colin Twiggs
February 21st, 2013 12:30 a.m. ET (4:30 p:m AET)
These extracts from my trading diary are for educational purposes. Any advice contained therein is provided for the general information of readers and does not have regard to any particular person's investment objectives, financial situation or needs and must not be construed as advice to buy, sell, hold or otherwise deal with any securities or other investments. Accordingly, no reader should act on the basis of any information contained therein without first having consulted a suitably qualified financial advisor. Full terms and conditions can be found at Terms of Use.
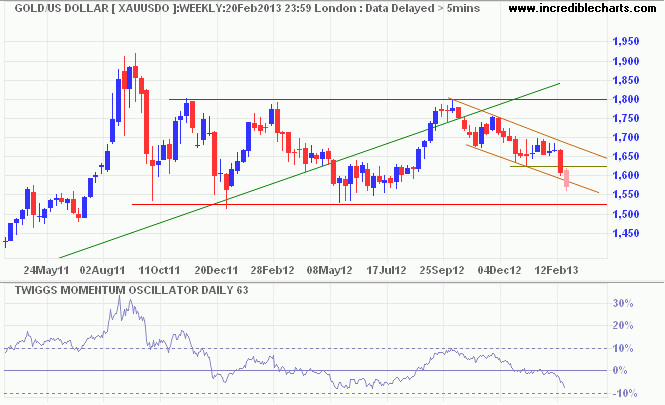
Gold is headed for another test of primary support at $1525 after breaking support at $1625. Breach of $1525 would signal a primary down-trend. 63-Day Twiggs Momentum breakout below -10% would strengthen the signal, while reversal above zero would suggest further ranging between $1500 and $1800.

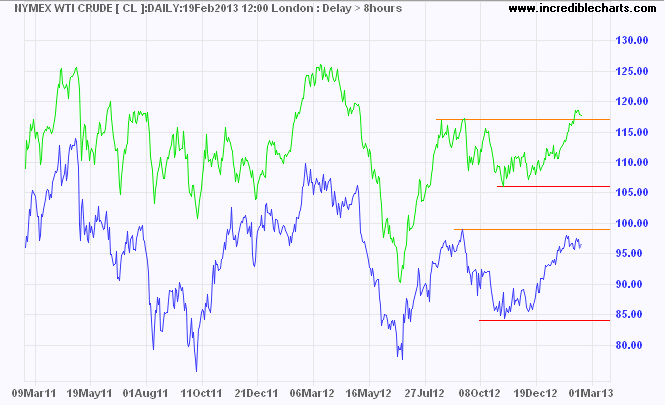
Brent Crude remains above $117/barrel, signaling a primary up-trend. Recovery of Nymex WTI above $99/barrel would confirm. Narrow consolidation below the resistance level is a bullish sign.

* Target calculation: 116 + ( 116 - 106 ) = 126
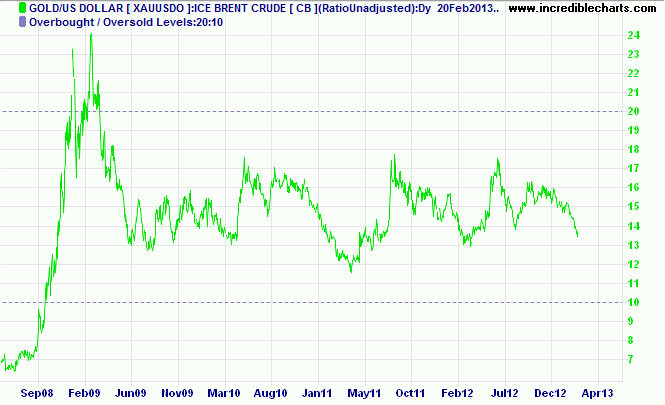
The gold-oil ratio is falling. Decline below 10 is a long-term buying signal for gold. In recent years fluctuations have been a lot narrower and a fall below 12 may be sufficient.

I am not yet convinced that gold is headed for a primary down-trend. Watch out for bear traps. Respect of primary support around $1500 seems as likely — and would present a buying opportunity.
Any intelligent fool can make things bigger, more complex, and more violent. It takes a touch of genius — and a lot of courage — to move in the opposite direction.
~ Albert Einstein

Author: Colin Twiggs is a former investment banker with almost 40 years of experience in financial markets. He co-founded Incredible Charts and writes the popular Trading Diary and Patient Investor newsletters.
Using a top-down approach, Colin identifies key macro trends in the global economy before evaluating selected opportunities using a combination of fundamental and technical analysis.
Focusing on interest rates and financial market liquidity as primary drivers of the economic cycle, he warned of the 2008/2009 and 2020 bear markets well ahead of actual events.
He founded PVT Capital (AFSL No. 546090) in May 2023, which offers investment strategy and advice to wholesale clients.
