S&P 500 reverse pennant
By Colin Twiggs
February 11th, 2013 2:30 a.m. ET (6:30 pm AET)
These extracts from my trading diary are for educational purposes. Any advice contained therein is provided for the general information of readers and does not have regard to any particular person's investment objectives, financial situation or needs and must not be construed as advice to buy, sell, hold or otherwise deal with any securities or other investments. Accordingly, no reader should act on the basis of any information contained therein without first having consulted a suitably qualified financial advisor. Full terms and conditions can be found at Terms of Use.
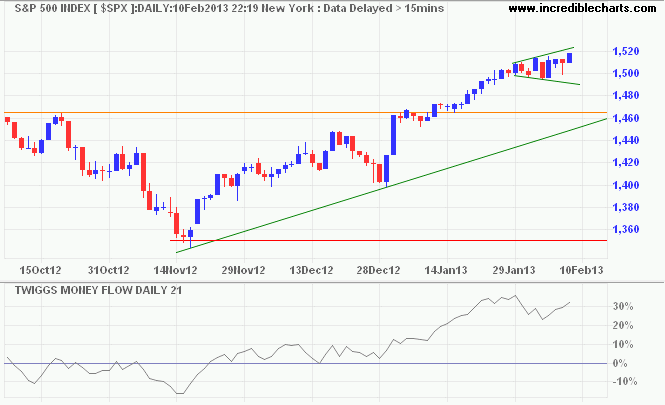
The S&P 500 displays a small broadening wedge (reverse pennant) on the daily chart. Respect of support at 1500 on the last down-swing (within the wedge) suggests an upward breakout. Watch for bearish divergence on 21-day Twiggs Money Flow — which would warn of retracement to the rising trendline.

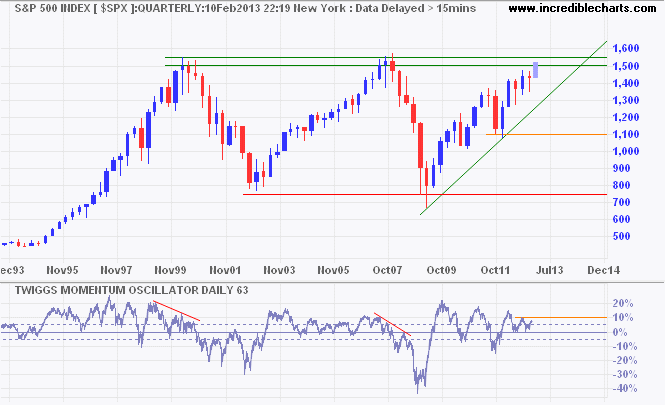
The quarterly chart warns us to expect strong resistance at the 2000/2007 highs of 1550/1575. Recovery of 63-day Twiggs Momentum above 10% would increase likelihood of an upward breakout — with a target of 1750* — while retreat below zero would suggest a primary reversal.

* Target calculation: 1550 + ( 1550 - 1350 ) = 1750
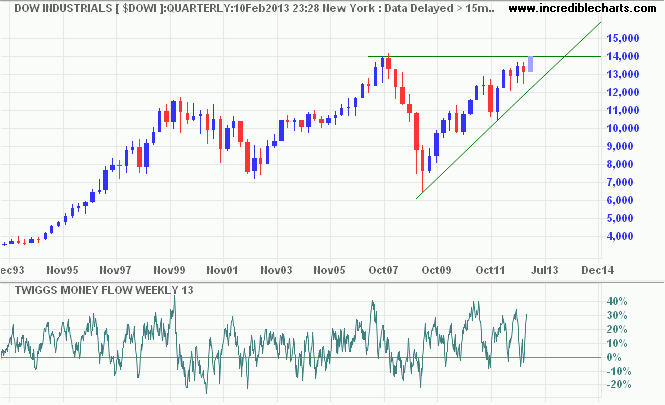
The Dow is similarly testing long-term resistance, at 14000. Breakout is likely, with 13-week Twiggs Money Flow troughs at zero indicating long-term buying pressure.

I repeat my warning from last week:
These are times for cautious optimism. Central banks are flooding markets with freshly printed money, driving up stock prices, but this could create a bull trap if corporate earnings, capital investment and employment fail to respond.
I was lucky. I grew up knowing that hard work and smart work [has] a greater impact on results than being passionate about something.
~ Mark Cuban

Author: Colin Twiggs is a former investment banker with almost 40 years of experience in financial markets. He co-founded Incredible Charts and writes the popular Trading Diary and Patient Investor newsletters.
Using a top-down approach, Colin identifies key macro trends in the global economy before evaluating selected opportunities using a combination of fundamental and technical analysis.
Focusing on interest rates and financial market liquidity as primary drivers of the economic cycle, he warned of the 2008/2009 and 2020 bear markets well ahead of actual events.
He founded PVT Capital (AFSL No. 546090) in May 2023, which offers investment strategy and advice to wholesale clients.
