US: Continued selling pressure
By Colin Twiggs
October 8th, 2012 3:00 a.m. ET (6:00 p.m. AET)
These extracts from my trading diary are for educational purposes and should not be interpreted as investment or trading advice. Full terms and conditions can be found at Terms of Use.
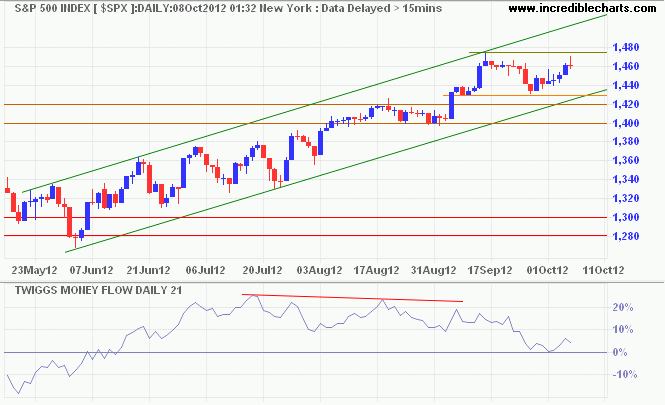
Resistance on the S&P 500 has shifted from 1450 to 1475, Friday's weak close and declining 21-day Twiggs Money Flow indicate selling pressure. Breakout above 1475 would signal a primary advance, while reversal below 1430 would warn of a correction.

* Target calculation: 1420 + ( 1420 - 1280 ) = 1560
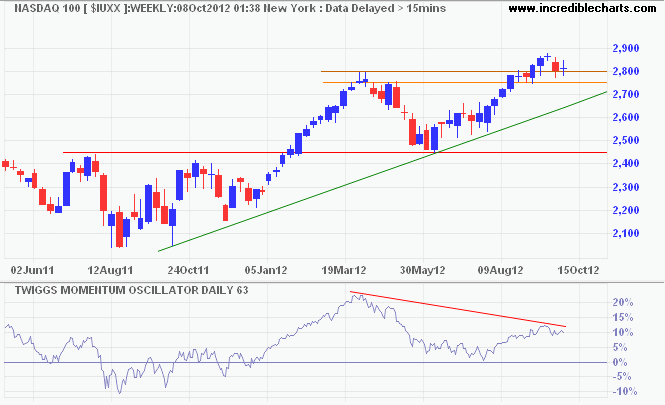
The Nasdaq 100 (weekly chart) is similarly testing support at 2800/2750. Bearish divergence on 63-day Twiggs Momentum indicates a weakening up-trend; reversal below zero would warn of a primary down-trend. Respect of support is would indicate another advance, while failure would strengthen the bear signal.

* Target calculation: 2800 + ( 2800 - 2450 ) = 3150
Markets are fundamentally volatile. No way around it. Your problem is not in the math. There is no math to get you out of having to experience uncertainty.
.....To avoid whipsaw losses, stop trading.
~ Ed Seykota

Author: Colin Twiggs is a former investment banker with almost 40 years of experience in financial markets. He co-founded Incredible Charts and writes the popular Trading Diary and Patient Investor newsletters.
Using a top-down approach, Colin identifies key macro trends in the global economy before evaluating selected opportunities using a combination of fundamental and technical analysis.
Focusing on interest rates and financial market liquidity as primary drivers of the economic cycle, he warned of the 2008/2009 and 2020 bear markets well ahead of actual events.
He founded PVT Capital (AFSL No. 546090) in May 2023, which offers investment strategy and advice to wholesale clients.
