Dollar down-trend, gold and commodities rally
By Colin Twiggs
September 13th, 2012 1:30 a.m. ET (3:30 p:m AET)
These extracts from my trading diary are for educational purposes and should not be interpreted as investment or trading advice. Full terms and conditions can be found at Terms of Use.
The Dollar Index broke primary support at 81.00 and the rising trendline on the weekly chart, signaling reversal to a primary down-trend. Fall of 63-day Twiggs Momentum below zero strengthens the signal. Expect retracement to test the new resistance level at 81.00/82.00. Respect is likely and would confirm the primary down-trend.
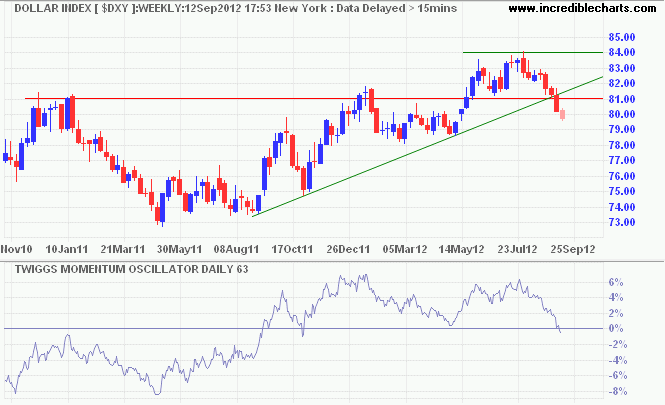
* Target calculation: 81 - ( 84 - 81 ) = 78
Spot Gold continues its advance toward $1800 per ounce*. Recovery of 63-day Twiggs Momentum above zero indicates a primary up-trend.
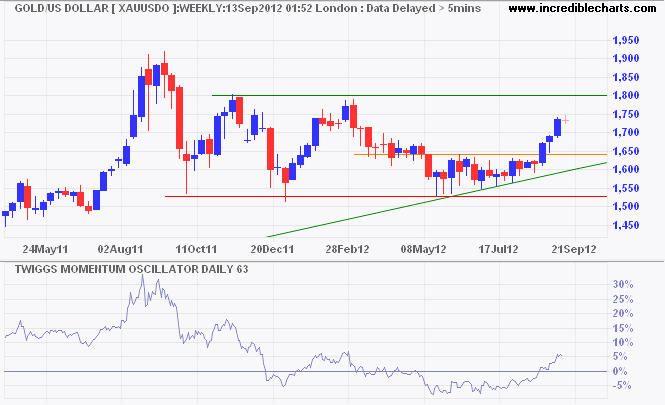
* Target calculation: 1650 + ( 1650 - 1500 ) = 1800
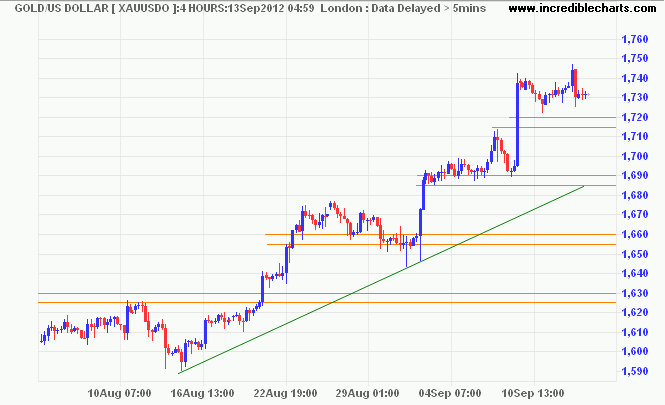
The 4-hour chart shows gold advancing in even steps of $30: from $1590 to $1630, $1660, $1690, and $1720. Each sharp jump is followed by several days consolidation, before another breakout. Occasional false starts — above $1700 — and reversals — below $1650 — keep traders on their toes, but this is a strong trend and should yield good results.
The Gold Bugs Index, representing un-hedged gold stocks, broke out of its double-bottom to signal a primary advance to 530*. Recovery of 63-day Twiggs Momentum above zero strengthens the signal.
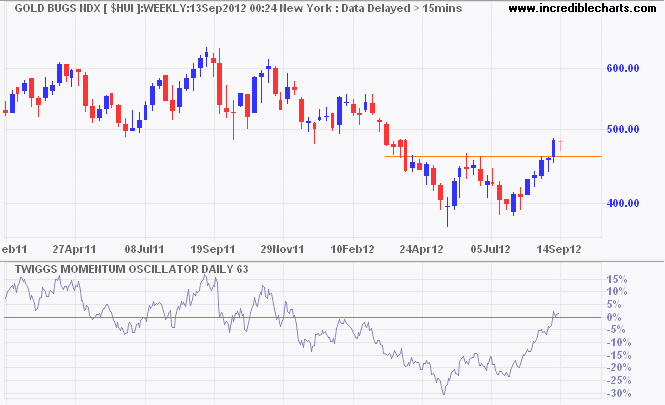
* Target calculation: 460 + ( 460 - 390 ) = 530
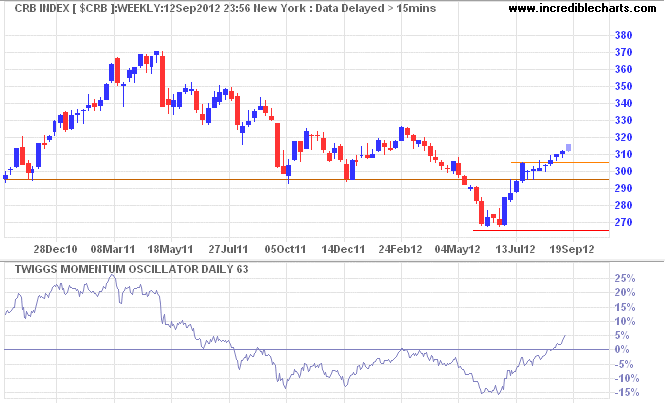
The CRB Commodities Index is also rising in response to the weaker dollar. Recovery of 63-Day Twiggs Momentum above zero suggests a primary up-trend. Expect a test of the 2012 high at 325.
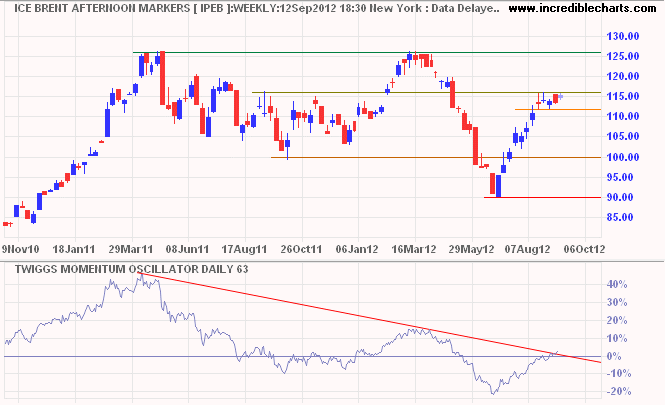
Brent Crude continues to consolidate between $112 and $116 per barrel. Upward breakout would test $126. 63-Day Twiggs Momentum recovery above zero strengthens the bull signal. Reversal below $112 is unlikely, but would signal another test of support at $100.
In theory there is no difference between theory and practice.
In practice there is.
~ Yogi Berra

Author: Colin Twiggs is a former investment banker with almost 40 years of experience in financial markets. He co-founded Incredible Charts and writes the popular Trading Diary and Patient Investor newsletters.
Using a top-down approach, Colin identifies key macro trends in the global economy before evaluating selected opportunities using a combination of fundamental and technical analysis.
Focusing on interest rates and financial market liquidity as primary drivers of the economic cycle, he warned of the 2008/2009 and 2020 bear markets well ahead of actual events.
He founded PVT Capital (AFSL No. 546090) in May 2023, which offers investment strategy and advice to wholesale clients.
