S&P 500 and Nasdaq 100 test key resistance
By Colin Twiggs
August 21st, 2012 4:00 a.m. ET (6:00 p.m. AET)
These extracts from my trading diary are for educational purposes and should not be interpreted as investment or trading advice. Full terms and conditions can be found at Terms of Use.
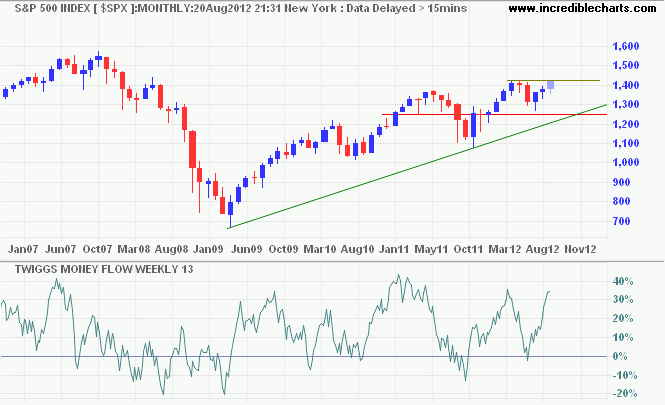
The S&P 500 Index is testing resistance at 1420 on the monthly chart. A trough above zero on 13-week Twiggs Money Flow indicates buying pressure. Breakout above 1420 would signal an advance to the 2007 high at 1560*.

* Target calculation: 1420 + ( 1420 - 1280 ) = 1560
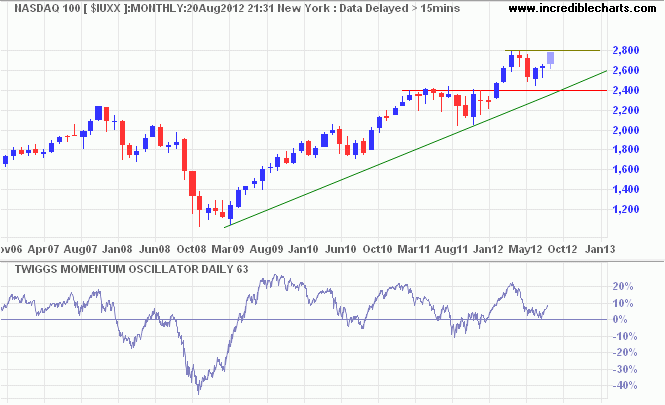
The Nasdaq 100 is similarly testing resistance at 2800 on the weekly chart. Breakout would offer a target of 3150*. A 63-day Twiggs Momentum trough above zero indicates continuation of the primary up-trend.

* Target calculation: 2800 + ( 2800 - 2450 ) = 3150
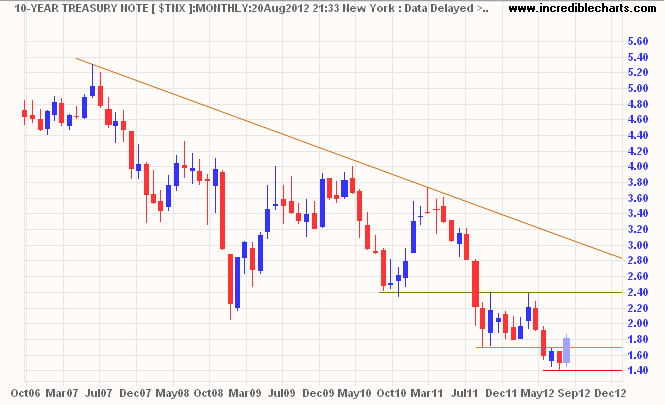
10-Year Treasury Yields recovered above initial resistance at 1.70 percent. Expect an attempt at the primary level of 2.40 percent. The Fed purchased $5 billion of Treasury notes/bonds (nominal) and MBS last week; so they are not the cause of the rise. Investors appear to be flowing out of Treasuries and driving stocks higher.

Nothing great is produced suddenly, since not even the grape or the fig is. If you say to me now that you want a fig, I will answer to you that it requires time: let it flower first, then put forth fruit, and then ripen.
~ Epictetus

Author: Colin Twiggs is a former investment banker with almost 40 years of experience in financial markets. He co-founded Incredible Charts and writes the popular Trading Diary and Patient Investor newsletters.
Using a top-down approach, Colin identifies key macro trends in the global economy before evaluating selected opportunities using a combination of fundamental and technical analysis.
Focusing on interest rates and financial market liquidity as primary drivers of the economic cycle, he warned of the 2008/2009 and 2020 bear markets well ahead of actual events.
He founded PVT Capital (AFSL No. 546090) in May 2023, which offers investment strategy and advice to wholesale clients.
